

BBT Chart Ovulation: Your Complete Step-by-Step Guide
Dr. Adeyinka AdegbosinYou wake, reach for the thermometer beside your bed, and see a number that looks almost identical to yesterday's. It's tempting to treat it as just another morning measurement. In reality, a BBT chart for ovulation can show whether your body has moved from the pre-ovulatory phase into the progesterone-dominant phase, provided you read the pattern rather than a single result.
The important limitation is easy to miss: basal body temperature confirms ovulation after it has happened. It doesn't reliably warn you that ovulation is about to occur today. Used consistently, however, your past charts can help you recognise your usual timing in future cycles and combine that information with earlier signs such as cervical mucus or LH testing.
Why Your Morning Temperature Tells a Story
You wake up, reach for the thermometer before you sit up, and see a number that seems almost too ordinary to matter. On its own, it usually is. Over several mornings, though, those small readings start to line up like footprints, showing where your cycle has already been.
Basal body temperature, or BBT, is your resting temperature after sleep. Because hormones can nudge that resting temperature slightly, charting gives you a day-by-day record of changes that are easy to miss in real time. It is not a diagnostic test by itself, but it can add practical context if you want to understand ovulation, cycle timing, or fertility awareness more clearly.

An Australian observational study published in 2015 evaluated basal-temperature measurement in 16 young women. In ovulatory cycles, researchers observed the familiar biphasic pattern: temperature typically increased by about 0.2–0.5°C shortly after ovulation and stayed higher until the next menstrual period. Read the Australian study on basal-temperature measurement
That timing matters.
Many people look at BBT as if it should act like an alarm bell for ovulation day. It works more like a receipt than a warning. A single high reading can happen for several reasons, but a sustained shift from your earlier baseline can confirm that your body has likely already moved into the post-ovulatory phase.
A more useful question is, “Does this reading fit a new pattern?” That approach helps you avoid treating one unusual morning as proof of ovulation. The value of charting comes from looking back, not guessing from one number in isolation.
This is the overlooked strength of BBT. It confirms ovulation after it has happened, then helps you learn from that pattern across several cycles. Once you can see when your temperature usually shifts, you can better anticipate when your fertile signs tend to show up in future cycles. You still need current-cycle signs to confirm timing, because bodies do not always follow the same schedule every month.
Practical rule: Use BBT to confirm and learn. Don't use one temperature reading as a real-time fertility forecast.
The gap between feeling informed and identifying the fertile window accurately is well documented. In a general-practice sample, only 2.1% correctly identified the fertile period, while 63.9% believed they were often or sometimes aware of it. The RACGP research report shows why clear fertility education matters. A BBT chart can improve the quality of the information you use, but it works best as one part of fertility awareness rather than a promise of conception or precise ovulation prediction.
The Science Behind the Thermal Shift
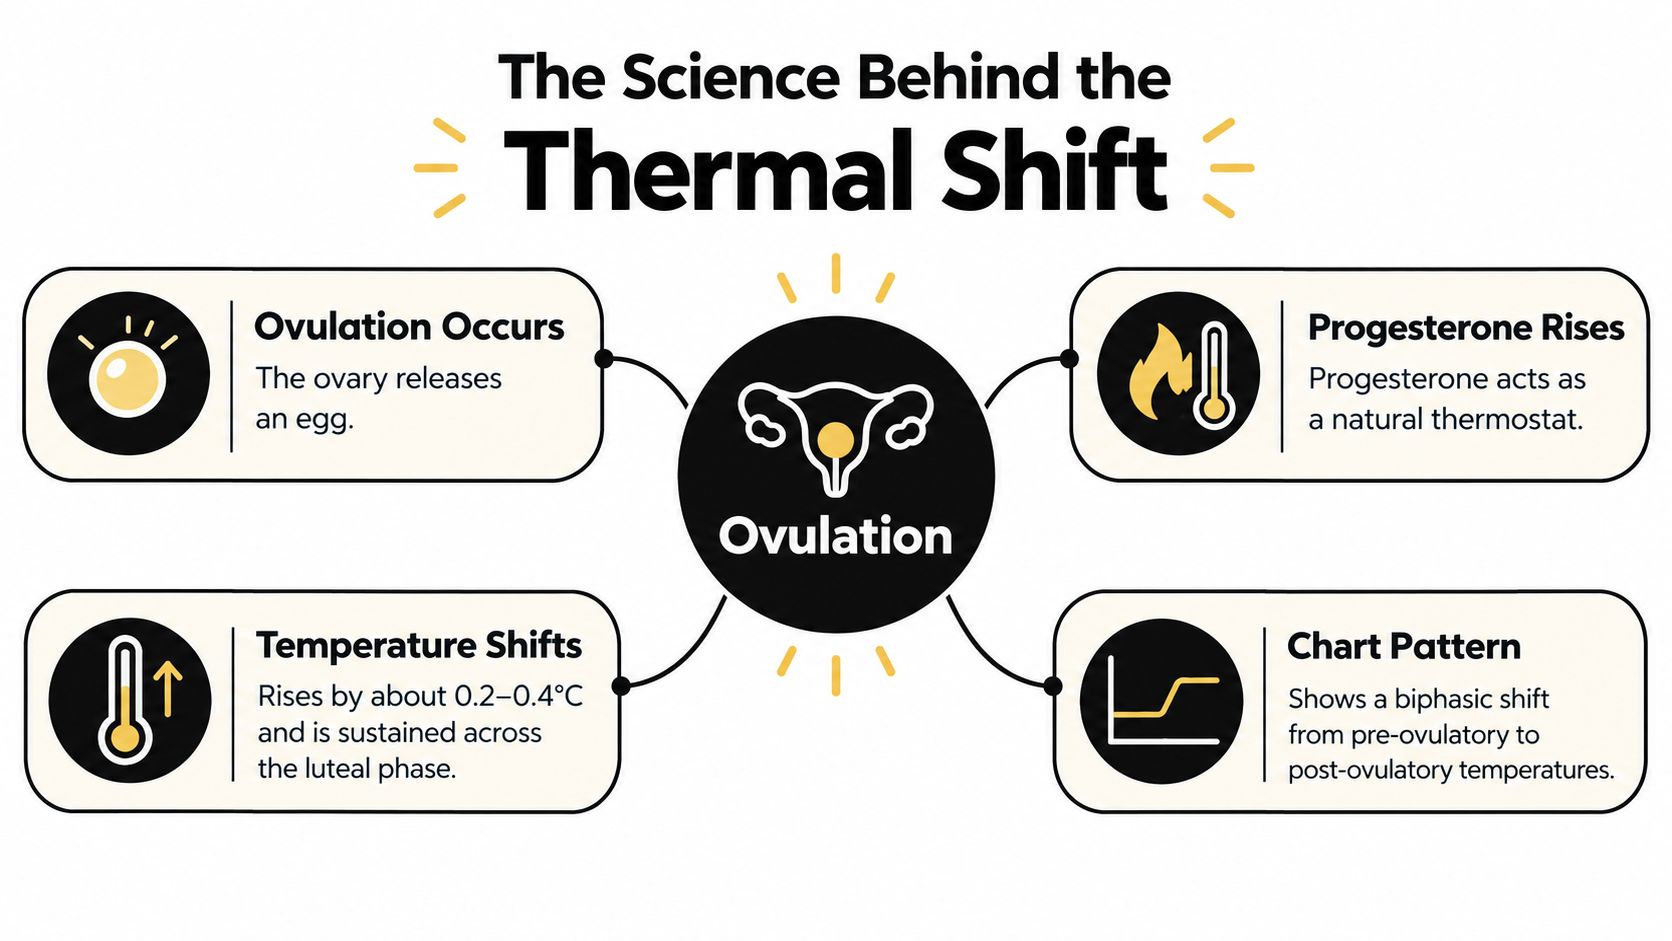
Your chart changes after ovulation because your hormones change after ovulation. Once an egg is released, the structure left behind in the ovary produces more progesterone. This hormone has a thermogenic effect, which means it raises your resting temperature slightly above your usual baseline.
Progesterone works like a low household heating system. The shift is subtle, not feverish, but careful daily tracking can reveal it as a small upward move on the chart. That is why BBT is so useful for confirmation. It shows that ovulation has likely already happened, then gives you a pattern you can study across cycles to better estimate when your fertile window tends to arrive next time.
Why the timing creates confusion
The delay is what trips people up.
You do not see the rise at the moment of ovulation. You see it afterward, once progesterone has had time to affect resting temperature. So a single higher reading does not announce that ovulation is happening today. The pattern only becomes meaningful when the temperatures stay up. By then, the most fertile days of that cycle may already be behind you.
This is why charts are often described as biphasic, with two broad temperature phases:
- Before ovulation: readings usually stay around your lower personal baseline.
- After ovulation: progesterone supports a higher temperature level.
- Across the chart: the shift matters when the rise is sustained, not when one reading sits higher than the rest.
As noted earlier, an Australian observational study described a thermal shift as a sustained rise above 0.2°C compared with the preceding six temperatures when it continued for three days. That does not mean every device or method captures the pattern equally well.
Measurement method matters
That distinction matters more than many people expect. A wrist skin-temperature signal is not automatically the same thing as oral BBT, even if both are displayed in an app. See the Australian fertility guidance on measurement quality. In a comparative Australian observational study, the wrist-based method did not agree with clinical digital oral measurements for identifying ovulation, which is a useful reminder that convenience and equivalence are not the same thing.
If medicines, cycle symptoms, or hormone treatment could be affecting your readings, discuss that with a qualified clinician. A general resource such as ProMD Health Bel Air hormone options may help you identify questions to ask, but it does not replace personalised medical advice. For a broader explanation of how charting fits into fertility awareness, you can learn more about basal body temperature and fertility.
A connected device such as the Venus Smart Basal Thermometer for Ovulation, Bluetooth BBT Tracker with App can send readings straight to an app, which may reduce missed entries. The interpretation still matters most. Clean tracking helps you see the thermal shift clearly, but the value of that shift is retrospective first, predictive second.
How to Measure BBT Accurately Every Day
You wake up, reach for the thermometer, and wonder whether one reading can really mean much. It can, but only if you collect it the same way often enough that your chart becomes comparable from one day to the next. BBT works like a trail of footprints. One mark tells you little, while a steady line shows where your cycle has already been and helps you judge where the next fertile window may fall.
Build the routine beside your bed
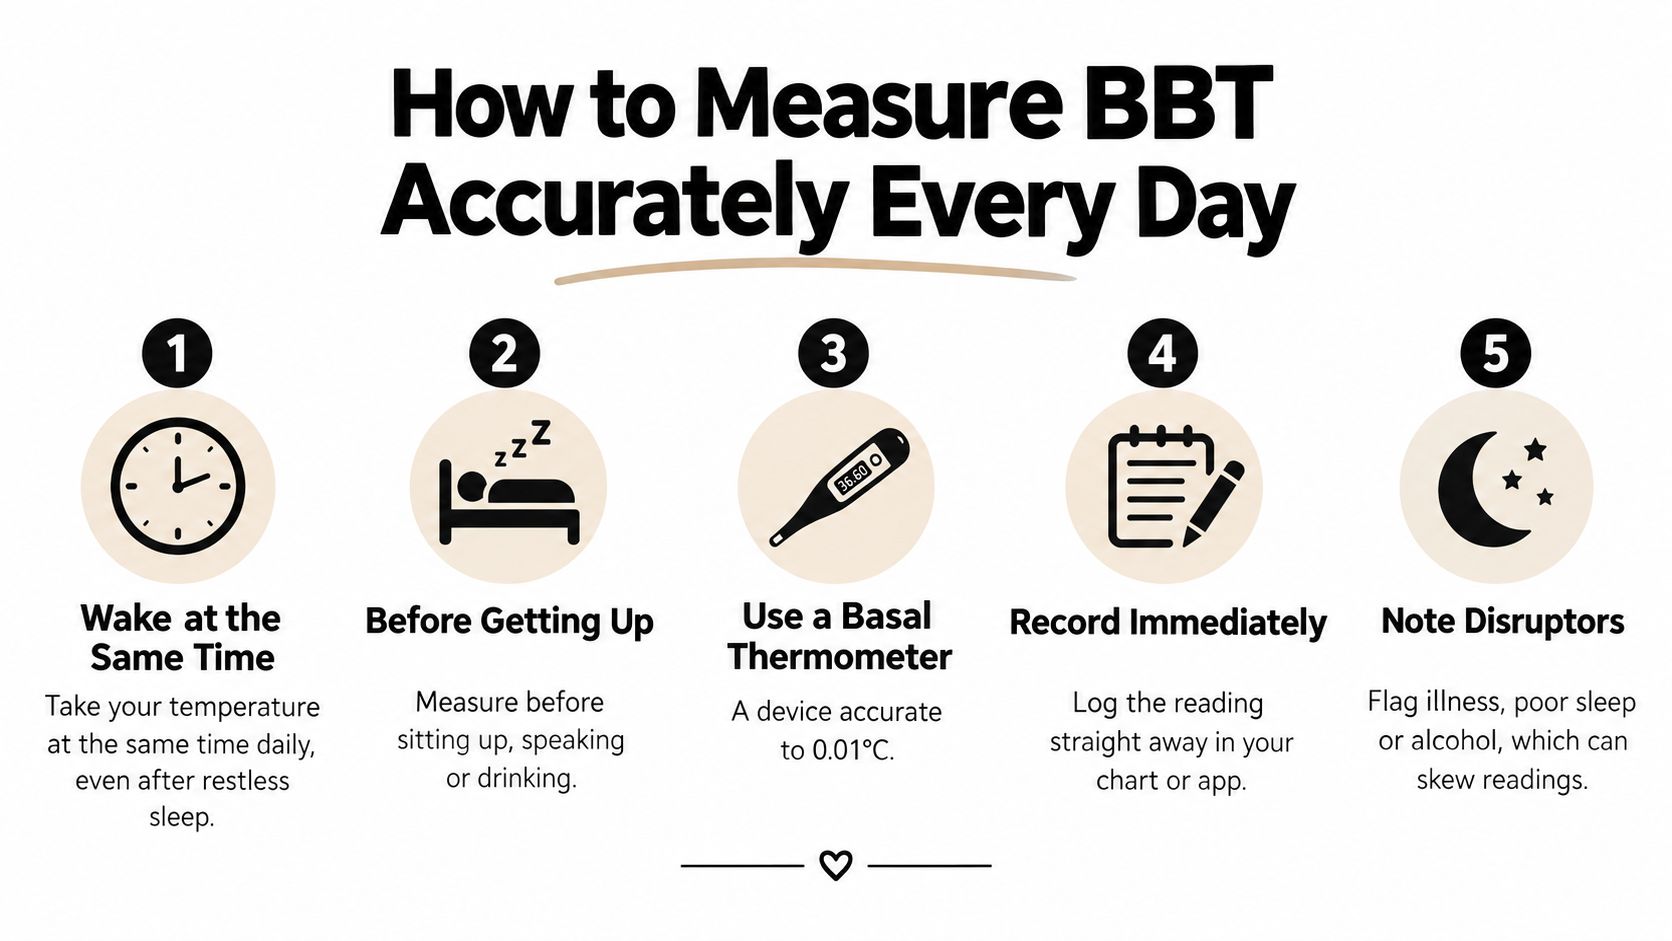
- Measure immediately on waking. Take your temperature before getting out of bed, sitting up, drinking water, or starting your day. Even small movement can shift the reading you are trying to capture.
- Keep the timing as consistent as possible. Aim for the same general time each morning. If your wake time changes, log the time and treat that number carefully instead of assuming it matches a reading taken under your usual conditions.
- Choose one anatomical site. Oral, vaginal, and rectal readings can each be used for charting, but the comparison only works well when you stick with one site for the whole cycle. Switching methods can blur the pattern.
- Use a dedicated basal thermometer. The temperature rise after ovulation is small, so charting is easier with a device designed for basal measurement rather than a general fever thermometer.
- Record the result straight away. Enter it in your app or chart before you forget. Add a note if sleep, illness, alcohol, or an unusual wake time may have affected the number.
As noted earlier, Healthdirect identifies a three-day sustained rise as the key retrospective signal that the fertile window has ended. That is why daily technique matters. You are not trying to prove ovulation from one isolated high reading. You are building a pattern that becomes clear across several mornings.
Choose consistency over perfection
A disrupted night does not ruin the entire cycle. Record the temperature, note what was different, and read it in context with the surrounding days. The goal is a usable chart, not a flawless one.
If you want a practical guide to choosing and using a basal body temperature thermometer, keep the focus on habits that you can repeat easily. The best routine is the one you can follow half asleep, every morning, for long enough to spot patterns from past cycles and use them to plan ahead.
Reading Your Chart and Recognising the Patterns
You wake up, log another temperature, and wonder what it means. The answer usually does not come from that single number. A BBT chart works more like a replay than a live broadcast. It confirms that ovulation likely happened after the pattern has formed, then helps you use that history to anticipate your next fertile window more accurately.
Start by ignoring comparisons with anyone else's chart. One person's normal baseline can be another person's unusually high reading. What matters is the shape and sustained change in your own cycle.
Many charts show two visual zones. Before ovulation, temperatures often sit in a lower cluster. After ovulation, progesterone tends to shift readings into a higher cluster. You are looking for a change in level that holds, not a dramatic one-day jump.
A simple example
Say your early readings stay within a fairly tight lower band for several days. Then one morning is higher, but the next day drops back down. Read that as a wobble, not a clear signal. Sleep disruption, timing, or ordinary variation can all create a lone high number.
Now picture a different pattern. The temperature rises, stays up, and continues to sit above the earlier group over the next mornings. That is the kind of shift people mean when they say a chart "looks ovulatory." The detailed study criteria were described earlier. Here, the practical takeaway is simpler. Confirmation comes from a sustained pattern, not from one isolated reading.
Cycle day can mislead if you treat it like a rule. A shift around day 14 in one month and later in another can still fit normal ovulation patterns for that person. Your chart is often more useful than calendar assumptions because it reflects what your body did in that cycle.
Read the chart in layers
- Start with the baseline: Do the earlier temperatures form a recognisable cluster, or are several readings obviously affected by illness, broken sleep, or unusual timing?
- Look for the lasting shift: A useful pattern is one that remains higher across multiple days, rather than flashing up once and disappearing.
- Add other signs: Compare the temperature pattern with cervical mucus, LH tests, cycle timing, and any quality flags you recorded.
The RACGP survey cited earlier showed that many people feel confident about fertility timing while still misidentifying the fertile window. That gap is exactly why chart reading matters. BBT does not predict ovulation in the moment. It helps you learn your pattern over several cycles so future fertile days become easier to estimate.
A confusing chart does not diagnose anovulation or infertility. It means the pattern is unclear. If that keeps happening, discuss it with an Australian GP or fertility specialist.
Common Mistakes and Real-Life Disruptions
A perfect chart is not a requirement for useful information. Shift work, a baby waking overnight, travel, illness, alcohol, and inconsistent sleep can all make one reading less representative of your resting temperature.
Australian guidance commonly recommends measuring after at least three hours of sleep, at roughly the same time, and before activity. The problem is that many instructions stop there. They tell you how to collect an ideal reading, but not what to do when your morning is anything but ideal. Review practical Australian charting rules.
Use quality flags instead of deleting data
Create a simple mark in your paper chart or app. Keep the reading, but make it clear that it shouldn't carry the same weight as a normal measurement.
- Sleep flag: Mark a reading after less than three hours of consolidated sleep or repeated overnight waking.
- Health flag: Note fever, illness, or anything else that could raise or disturb temperature.
- Routine flag: Record a different wake time, travel, or a changed measurement site.
- Lifestyle flag: Note unusual alcohol intake or another significant evening disruption.
This approach preserves the history of your cycle. It also stops one abnormal number from controlling your interpretation. A flagged reading can sit beside the chart as context rather than being mistaken for a hormonal event.
Keep the data, label the disruption, and judge the trend around it.
The biggest misconception
Many people begin charting because they want to know when ovulation is coming. BBT can't reliably provide that warning on its own. It confirms a likely ovulatory shift after the event, so use cervical mucus observations or LH testing when you need information earlier in the cycle.
A quality flag isn't a failure. It's a record of how the measurement was taken. If your sleep is unpredictable every morning, your chart may still show useful patterns, but persistent irregular or confusing results should be reviewed with a health professional rather than self-diagnosed.
Integrating BBT with Smart Tracking Apps
Manual charting can work well, but entering a temperature while half asleep creates opportunities for transcription errors and forgotten readings. A Bluetooth thermometer can send the result to an app, where you can view the curve alongside cycle dates and other observations.
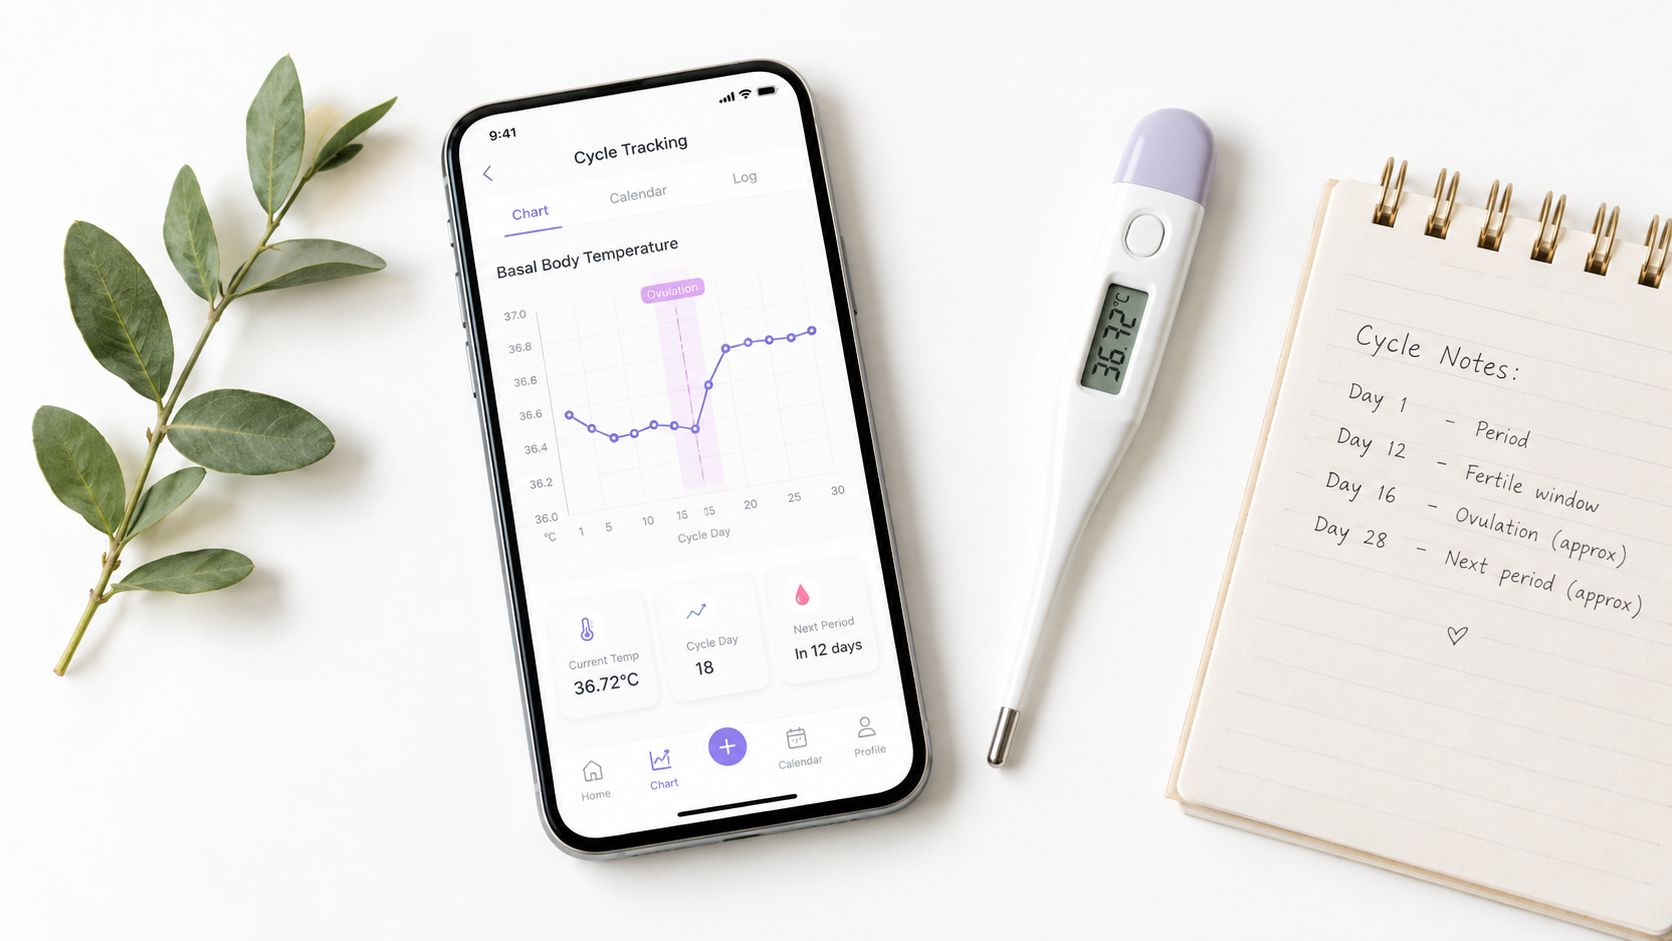
The technology is most useful when it supports sound interpretation. An app can organise BBT readings, show changes over time, and let you record LH tests, cervical mucus, symptoms, or disrupted sleep. It shouldn't turn a prediction into proof, especially because the temperature rise is retrospective.
For help comparing digital options, you can find the best cycle tracker according to the features that matter to you, such as privacy, manual entry, symptom logging, or device compatibility. Your choice should make charting easier to sustain, not encourage you to overinterpret every daily fluctuation.
A unified record can be particularly helpful when your cycles don't follow a predictable calendar. The Venus Health App ecosystem can bring BBT readings together with other fertility observations, while tools such as LH tests provide an earlier signal than temperature alone. See how app-based tracking solutions can be customised for your fertility journey.
The following video offers a visual overview of cycle tracking workflows:
Taking Control of Your Fertility Awareness
A BBT chart turns a vague impression into a record you can revisit. Measure before getting up, use the same site, record the result, flag disrupted readings, and look for a sustained pattern rather than chasing a perfect line.
The most valuable lesson is the timing. BBT confirms ovulation retrospectively. Your previous charts can help you recognise when fertile signs often appear in future cycles, while current-cycle cervical mucus or LH observations can provide earlier information.
If you're reviewing nutrition or considering fertility supplements for women, treat those choices as part of a wider health conversation rather than as a replacement for chart interpretation or medical care. Bring persistent irregularities, absent shifts, or confusing patterns to an Australian GP or fertility specialist.
Start with the data you can collect consistently. Even an imperfect chart can teach you how your own cycle behaves.
Venus Health Co. offers app-connected tools for tracking basal body temperature and organising fertility observations in one place. Visit Venus Health Co. to explore the Bluetooth basal thermometer, LH testing options, and related health-tracking tools for a more consistent BBT chart ovulation routine.