

Basal Body Temperature and Fertility: A Practical Guide
Dr. Adeyinka AdegbosinThe alarm goes off, but you stay still for a moment. On the bedside table, a thermometer is ready, your phone is within reach, and you're wondering whether this morning's number might tell you something about ovulation. That small reading can become useful fertility information, but only when you understand what it measures, what it can't tell you, and how to collect it consistently.
Basal body temperature, or BBT, is a resting-state cycle signal. It reflects the hormonal change that follows ovulation, rather than predicting ovulation in advance. Australian fertility-awareness guidance describes a rise of about 0.2 to 0.5°C after ovulation, with temperatures remaining high until the next period (Family Planning NSW guidance). Used thoughtfully, BBT can help you understand your own pattern without turning every reading into a verdict.
What Basal Body Temperature Really Tells You
You wake before dawn, reach for the thermometer beside the bed, and record a number before sitting up. That reading is useful because it captures your body at rest, before movement, food, conversation, or a shower changes the result. A temperature taken later in the day still describes body temperature, but it is not a basal body temperature.
BBT is a retrospective fertility sign. It usually helps you recognise that ovulation has already occurred rather than pinpointing the day beforehand. After ovulation, progesterone raises the body's resting temperature slightly. Because the change is small, inconsistent timing, illness, activity, or a different measurement site can make the pattern harder to interpret, as explained in healthdirect's fertility-awareness guidance.
Some connected thermometers and fertility apps can record readings automatically while you sleep and transfer them to a chart. Their main value is reducing handling and recording mistakes, not turning BBT into a prediction tool. You still need consistent habits and a sensible reading of the overall pattern.
A quiet signal, not a wellness score
BBT works like a daily line in a hormonal record. A single number says little. A run of readings may show a lower pattern before ovulation, followed by a sustained higher phase.
Keep these parts consistent:
- Time: Take the reading at your usual waking time.
- Position: Measure before sitting up or leaving bed.
- Thermometer: Use the same device throughout the cycle.
- Body site: Keep the measurement site unchanged.
- Recording method: Log the number promptly, including unusual conditions.
A chart can also show the length of the phase after ovulation, often called the luteal phase. Repeated patterns may give you useful topics to discuss with a clinician, but BBT alone cannot diagnose a hormonal disorder or prove the exact day ovulation occurred.
Practical rule: Treat the pattern as information, not a performance review. A disrupted reading does not mean you have failed at charting.
If you use BBT for contraception, interpretation requires particular care. Australian family-planning guidance describes the fertile window as over after three consecutive higher temperatures, while also explaining that fertility-awareness methods need correct, consistent use and are often taught alongside cervical mucus observation (Family Planning NSW's method overview).
The Hormonal Shift Behind the Temperature Rise
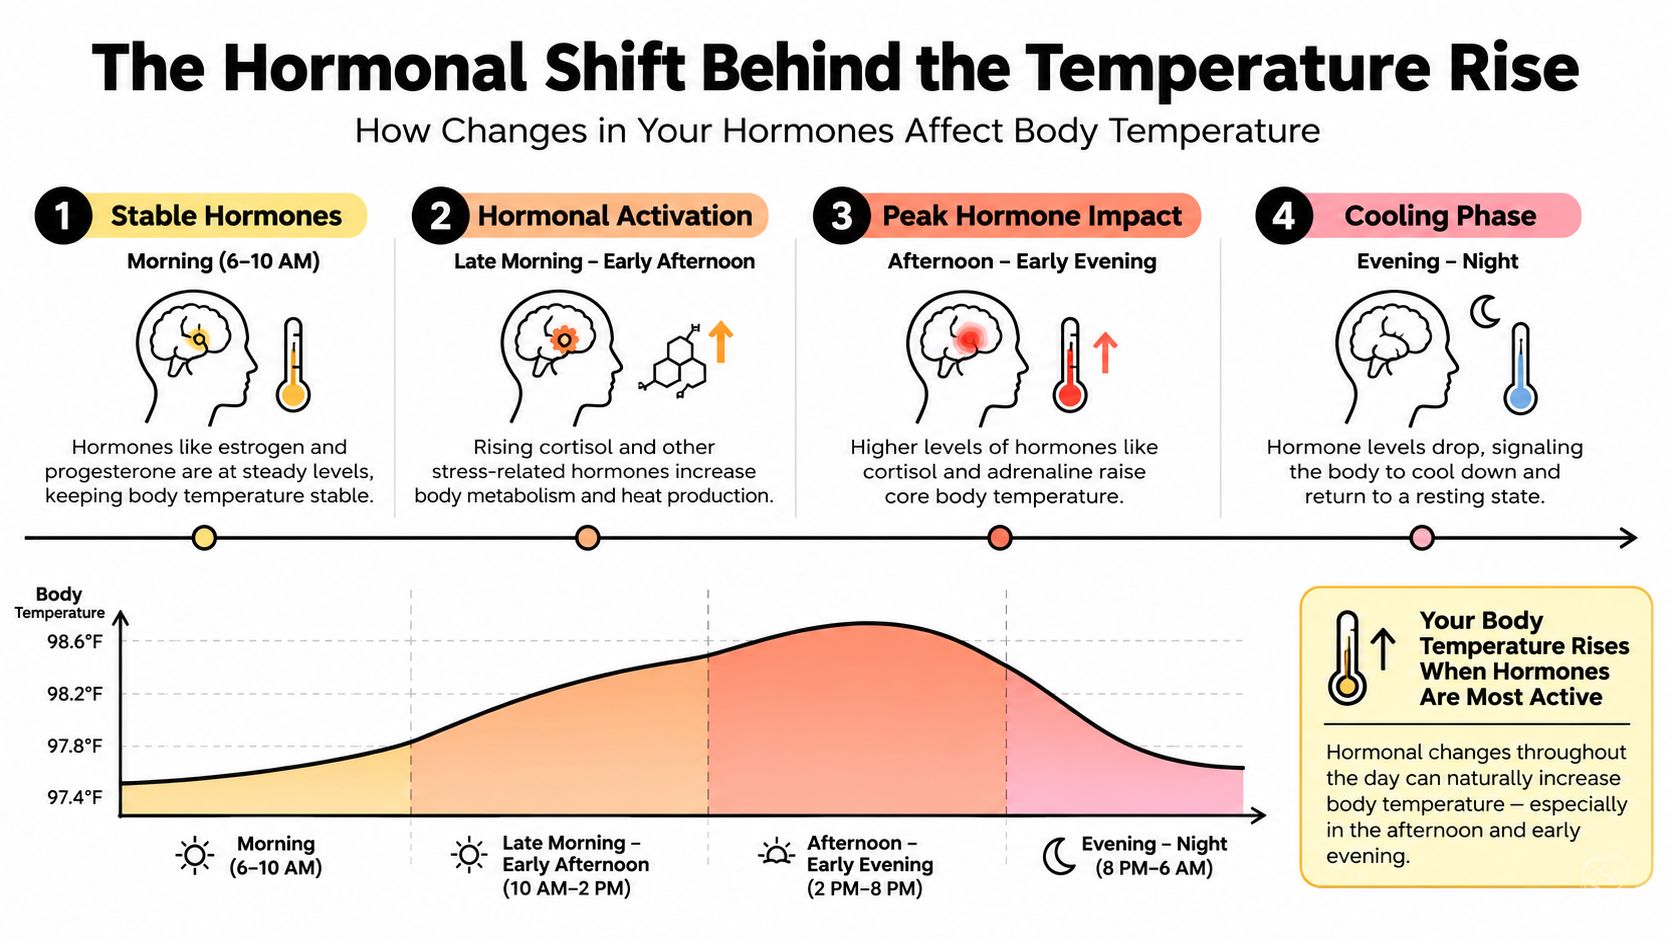
A morning reading may look unchanged on the day an egg is released. The temperature shift usually follows ovulation, because it reflects the hormone produced afterward rather than the release itself.
During the follicular phase, oestrogen is the dominant reproductive hormone, and resting temperatures generally remain at a lower, fairly steady level. An LH surge signals that ovulation may be approaching, but it does not usually create an immediate temperature rise.
After ovulation, the emptied follicle becomes the corpus luteum. It produces progesterone, which acts on the hypothalamus, the brain region involved in temperature regulation. The resting set point then moves slightly higher. Australian clinical information places the usual BBT increase at approximately 0.2 to 0.5°C after ovulation.
Why the pattern matters more than the size
The rise is small, so a dramatic spike is not the goal. Look for a sustained change from your own earlier readings. One chart may show a clear step upward; another may show a gradual climb or one lower reading among otherwise higher temperatures.
If pregnancy does not occur, progesterone falls toward the end of the luteal phase. Temperature often drops around the start of menstruation, although real charts rarely follow a perfectly tidy sequence. A high reading can have many causes, while one lower reading cannot independently explain the hormonal picture.
For a plain-language discussion of progesterone and possible symptoms linked with lower levels, progesterone restoration for wellness may provide useful background. It complements personalised medical advice rather than replacing it.
A visual comparison can make the sequence clearer. The menstrual cycle hormones graph shows how the follicular and luteal phases relate to changing hormone levels.
An app-connected device such as the Venus Smart Basal Thermometer for Ovulation, Bluetooth BBT Tracker with App can record and sync readings automatically. That reduces copying errors from small decimal values and may make a routine easier to maintain. It does not alter the biology: BBT still shows the temperature pattern associated with progesterone after ovulation. If the higher readings remain above the coverline, interpretation is often clearer, although illness, disrupted sleep, or other conditions can make the pattern harder to read.
How to Measure BBT the Right Way Every Morning
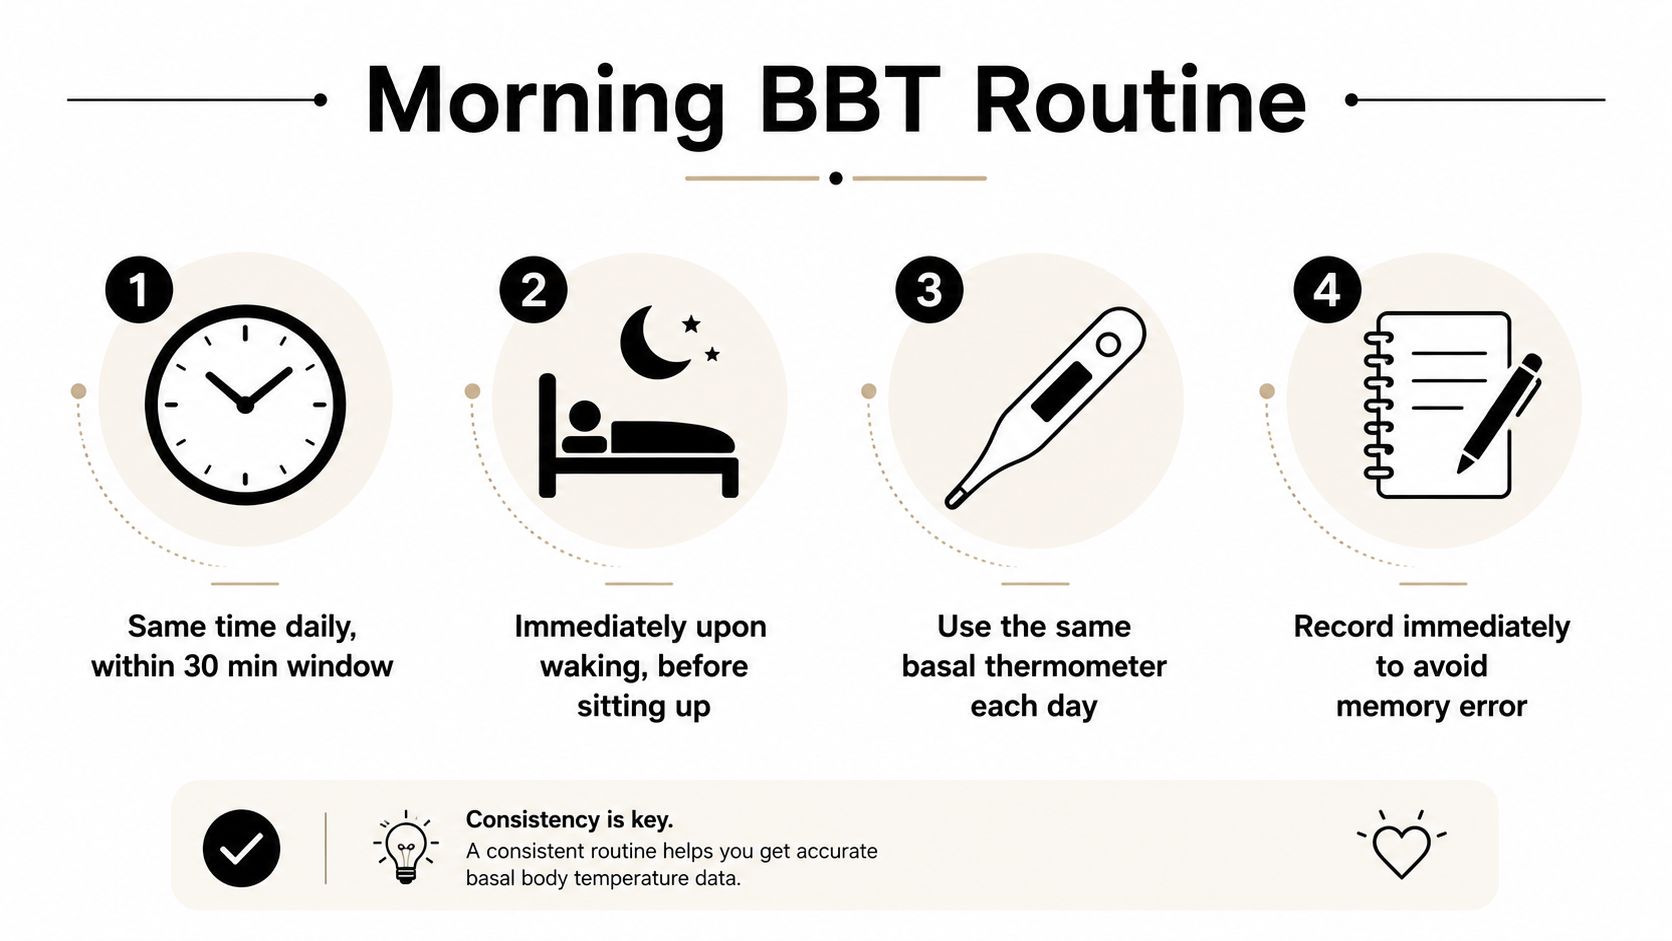
Your first temperature reading depends on what happened before it. If you have been awake, walking around, drinking, or checking messages, ordinary activity may already have shifted your temperature. BBT works best after a sustained period of rest, before your morning begins.
Take it immediately on waking, before getting out of bed, and at the same time each day. Work, parenting, and shift duties can make a fixed time difficult. Record the actual time and any unusual circumstances instead of treating every reading as identical.
A practical morning protocol
- Keep the thermometer beside the bed. You can measure without standing up or searching for it.
- Measure before activity. Avoid sitting up, drinking, eating, talking, or checking your phone first.
- Use one measurement site. Oral measurement is common. Consistency matters more than changing between sites.
- Choose a basal thermometer where possible. It is designed to show the small temperature changes used in fertility charting.
- Record the result straight away. Note disrupted sleep, illness, an unusual waking time, or anything else that could affect interpretation.
A display with more decimal places can make a small change easier to read, but it cannot correct an inconsistent routine. Repeating the same steps each morning usually improves the usefulness of the chart more than pursuing extra precision.
Manual charting or automatic syncing
Paper charting remains a practical option. An app can display trends, store notes, and place BBT beside cervical mucus or LH results. With an app-connected thermometer, the reading transfers directly to your phone, reducing transcription mistakes and the chance of forgetting a value while still half asleep. Automation helps with the routine. It does not remove the need to measure under comparable conditions or record sleep and illness.
The guide to using a BBT thermometer explains the basic setup and measurement habits. If you track broader health information, the Venus AI Smart Scale, Body Composition and Body Fat Scale records body-composition information and connects with the Venus App. It is a separate device, not a fertility thermometer, so it cannot replace BBT measurement.
Morning checklist: Wake, measure before moving, use the same site, record the result, then note anything unusual.
Reading Your BBT Chart and Spotting Ovulation
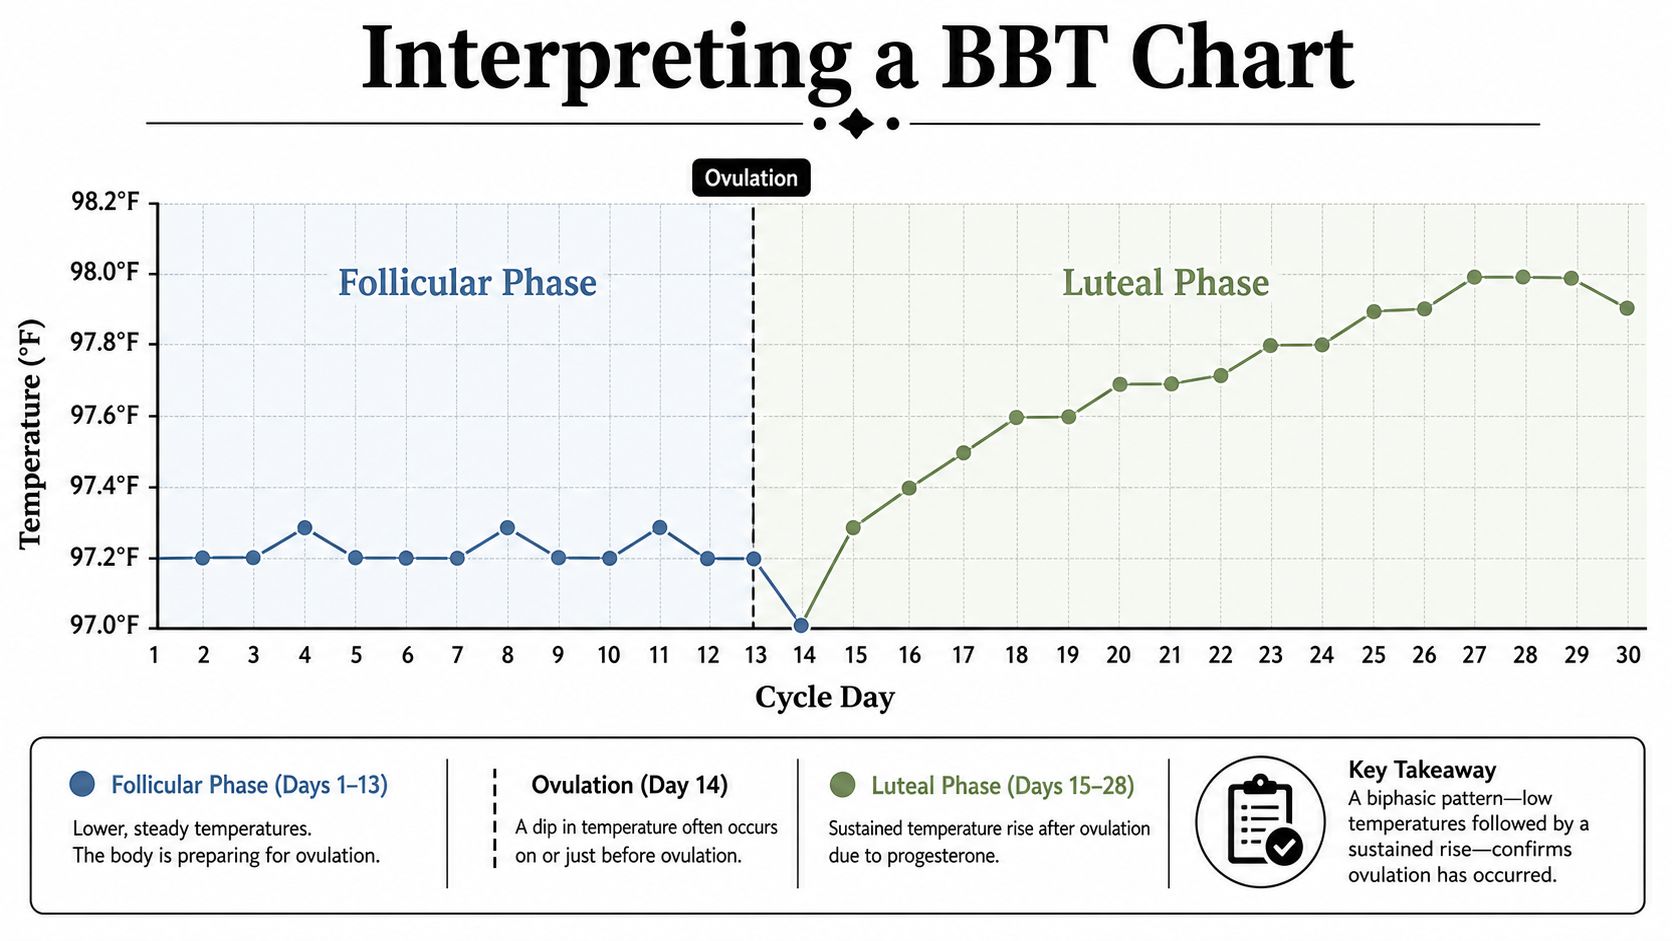
A finished BBT chart rarely resembles the neat examples online. Mark the first day of menstrual bleeding as cycle day one, then place each morning's reading in sequence. One temperature cannot identify ovulation. The useful signal is a sustained change, much like seeing a tide remain higher rather than reacting to one wave.
The classic pattern is biphasic. Readings usually form a lower group first, followed by a higher group after ovulation. Fertility-awareness charting commonly looks for three consecutive higher temperatures before treating the shift as established, as outlined in Family Planning NSW guidance.
Three charts you might recognise
The clear biphasic chart has a fairly steady lower phase and then a rise that stays higher. Once that pattern is visible, ovulation probably occurred shortly before the rise. Because BBT looks backward, the chart is more useful for learning your recurring timing than for identifying the fertile days in real time.
The slow-rise chart climbs across several mornings rather than forming one clear step. It may still show a thermal shift if the higher readings remain high, but the exact ovulation day is harder to assign. Australian clinical guidance describes BBT as indirect evidence, rather than definitive confirmation of the day itself (RACGP guidance on ovulation assessment).
The flat or chaotic chart lacks a lasting higher phase, or temperatures jump repeatedly without a consistent direction. Disrupted measurements, an irregular cycle, or no clear ovulatory shift can produce this appearance. One untidy cycle does not establish a diagnosis.
Some apps and paper charts add a coverline between the earlier lower readings and later higher ones. It is a visual guide, not a direct hormone reading. Flag an unusually high temperature after poor sleep or an unusually low one after waking early, then judge the surrounding pattern. App-connected thermometers can reduce transcription errors and forgotten entries, while the person still needs to review unusual conditions rather than accept every automated interpretation.
If confirmation matters, a clinician may request a serum progesterone blood test, ideally 7 days after the temperature rise. BBT can suggest timing, while progesterone testing provides a separate clinical assessment of ovulation.
Combining BBT With LH Tests and Other Fertility Signs
BBT becomes more useful when you pair its backward-looking signal with markers that can provide information before ovulation. LH tests detect the urinary LH surge, while BBT reflects the later progesterone effect. Cervical mucus adds another observation because its changes can help show that the fertile window is opening.
| Marker | What it detects | Timing relative to ovulation | Key limitation |
|---|---|---|---|
| BBT | Progesterone-related resting temperature shift | After ovulation | Retrospective, and sensitive to disrupted measurement |
| LH tests | Urinary luteinising hormone surge | Before ovulation | A surge doesn't guarantee that ovulation occurred |
| Cervical mucus | Oestrogen-related fertile mucus pattern | Around the fertile window | Observation is subjective and can be affected by discharge or products |
| Wearable temperature | Ongoing skin or temperature trends | May show a changing pattern around ovulation | Device algorithms and measurement sites vary |
LH tests and BBT answer different questions. An LH result may tell you that your body is signalling that ovulation could be near, while a sustained temperature rise can provide retrospective support that ovulation occurred. For further background on LH and related biomarkers, see these hormone health insights.
A combined daily routine
Use the markers at the times they naturally fit your day:
- On waking: Take BBT before sitting up and record the result.
- During the day: Observe cervical mucus and note whether it seems dry, sticky, creamy, or more slippery and stretchy.
- As directed by the test instructions: Use an LH strip and record the result rather than relying on memory.
- At the end of the cycle: Review all signals together instead of treating one result as conclusive.
The guide to tests for ovulation explains how different tracking methods can fit together. The Venus Ovulation Predictor Test Kit is described as an at-home LH strip option that can be logged manually or entered into a fertility app. Product claims about test accuracy or timing should be read alongside the instructions supplied with the kit.
Wearable devices and app-connected thermometers can reduce the burden of manual entry. They don't remove the need to understand the signal, check unusual readings, or consider your symptoms and cycle history. Automation improves the record only when the underlying measurement and interpretation remain appropriate.
Troubleshooting Common BBT Chart Problems
A BBT chart can become confusing after one late night, a broken sleep, or a trip across time zones. That doesn't mean the cycle is abnormal. It means the reading may contain information about the night as well as the reproductive phase.
Sleep disruption is especially important because BBT depends on a resting state. Waking repeatedly, measuring after only a short sleep period, or taking the reading much later than usual can make the number less comparable with the rest of the chart. Alcohol, fever, and illness can also raise temperatures independently of ovulation.
Mark the context, not just the number
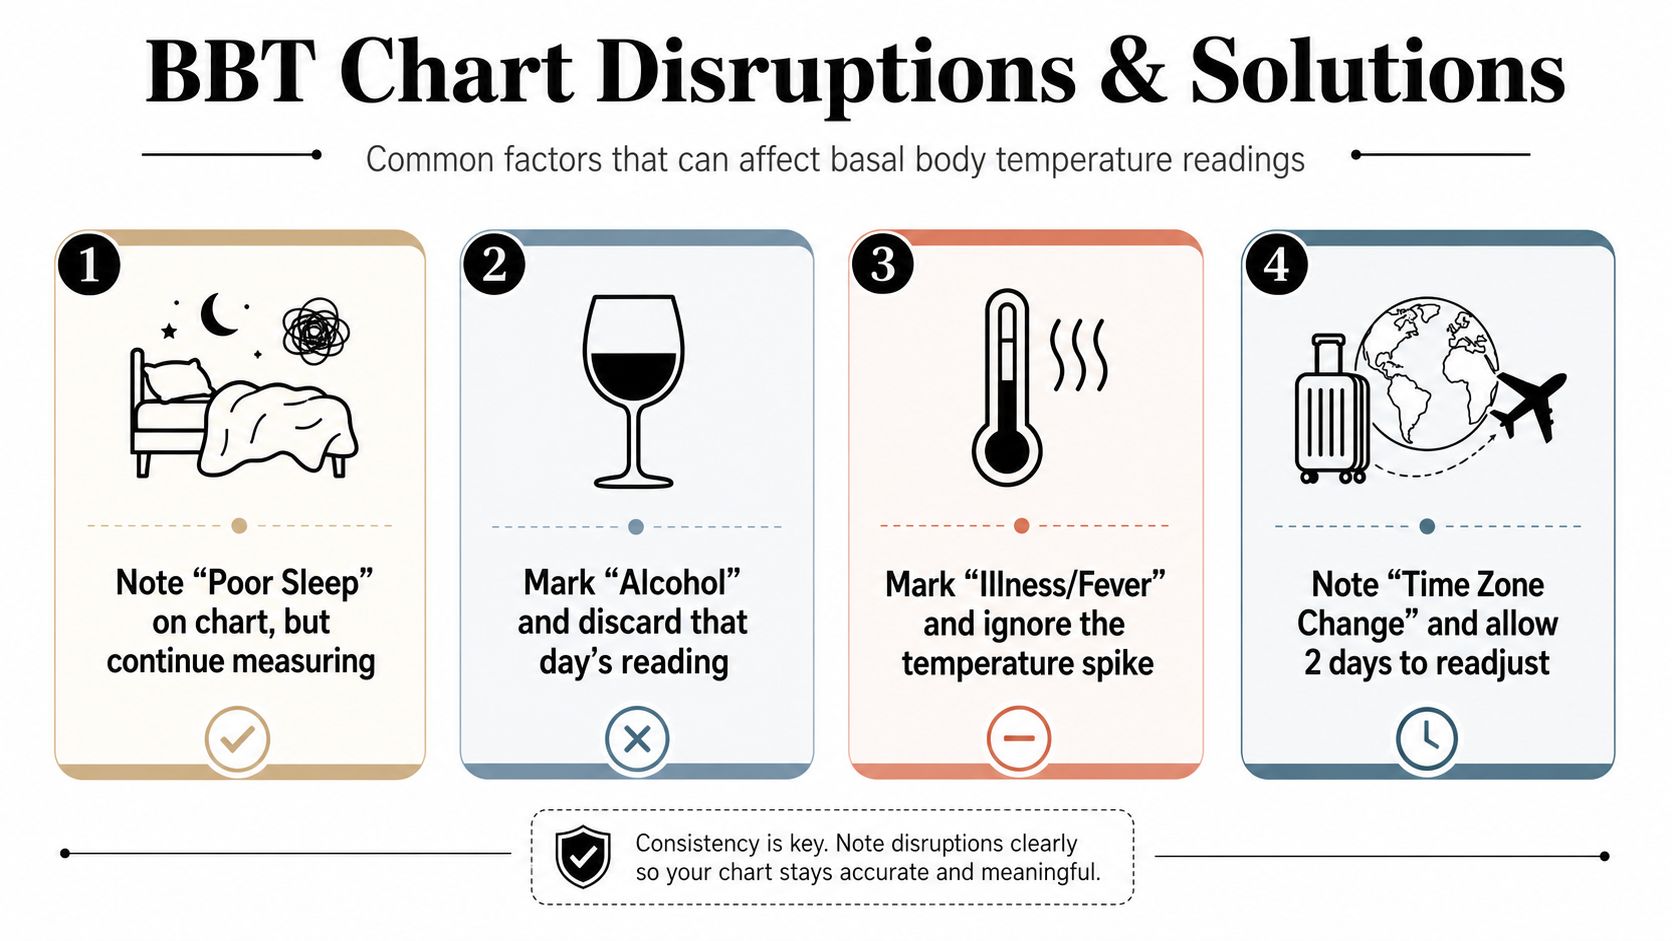
Use a note or chart symbol for readings affected by:
- Fragmented sleep: Keep measuring, but flag the result so you don't interpret it with the same confidence.
- Alcohol: Record the evening clearly and treat the following temperature cautiously.
- Illness or fever: Don't use a fever-related spike as evidence of a progesterone shift.
- Travel: Note the time-zone change and allow your routine to settle before drawing conclusions.
- Different measurement site: Mark the change because readings from different sites may not be directly comparable.
- Unusual timing: Record whether you woke earlier or later than normal.
When the shape looks unusual
A slow rise can be difficult to separate from measurement noise. A stair-step pattern may still become meaningful when the readings settle into a higher phase. An early-cycle dip may be ordinary variation, while a mid-cycle dip can be an isolated disruption or part of a more complicated pattern.
App algorithms may identify or exclude outliers, but don't accept an automated interpretation without checking the notes. The app can't know whether you had a fever unless you record it, and it can't reliably infer every cause of an unusual temperature from the number alone.
Give the chart context: a temperature without its sleep, illness, timing, and travel notes is only part of the record.
Aim for a consistent period of sleep before measuring, use the same body site, and keep the thermometer in the same place each night. If your chart remains difficult to interpret, bring several cycles of data to a GP or fertility clinician rather than trying to diagnose yourself from one unusual month.
Building a Sustainable Tracking Routine and Knowing When to Seek Help
A sustainable routine should fit into an ordinary morning. Take your temperature before sitting up, let an app-connected thermometer record it automatically, then add LH results, cervical mucus, sleep, illness, or travel notes when relevant. Automation reduces forgotten entries and transcription errors, but it cannot explain every unusual reading. Consistency still gives the chart its meaning.
A weekly review keeps the chart useful
Once a week, review the chart rather than judging one temperature in isolation. Look for:
- A possible sustained higher-temperature phase.
- How LH results and cervical mucus relate to the later BBT pattern.
- Readings affected by illness, alcohol, travel, or poor sleep.
- A recurring pattern in the length of the post-ovulation phase.
- Questions to take to a clinician.
Australian guidance describes BBT as indirect evidence of ovulation. When confirmation is clinically appropriate, a serum progesterone test may provide a separate benchmark, as noted in RACGP guidance. BBT can support fertility planning, but it cannot assess every part of fertility.
When professional input makes sense
Arrange a GP or fertility review if your cycles are consistently shorter than 21 days or longer than 35 days, your luteal phase appears shorter than 10 days, or a biphasic pattern does not appear across multiple cycles. If you are trying to conceive, assessment is commonly considered after 12 months when under 35, or after 6 months when 35 or over. These timeframes are prompts for discussion, not pass-or-fail rules, and individual circumstances may support earlier advice.
Seek help sooner with known thyroid disease, PCOS, irregular bleeding, or a history of pregnancy loss. You can also discuss your chart if tracking increases anxiety or interferes with intimacy. This practical guide to when to see a clinician can help you prepare for an appointment.
BBT charting should build body literacy, not pressure. Several cycles of readings, symptoms, and cycle history give a clinician more context than one confusing month.
Venus Health Co. offers a Bluetooth basal thermometer that records morning BBT and syncs with the Venus App, where you can log LH tests, cervical mucus, and symptoms. Automatic recording can reduce manual entry while you build a consistent fertility record. Visit Venus Health Co. to explore the available tracking tools.