

BBT After Ovulation What Your Temperature Really Means
Dr. Adeyinka AdegbosinYou check your thermometer before your feet touch the floor, see a reading a little higher than yesterday, and pause. Does this mean ovulation happened overnight? Is the rise large enough? Should a small dip worry you?
If you're using BBT after ovulation, the most helpful shift in thinking is simple: basal body temperature is mainly a confirmation tool, not a prediction tool. It can show that your body has moved into the post-ovulation phase, but it can't reliably tell you that ovulation is happening today from one isolated number.
This guide follows the reading from the biology behind the rise to the pattern on your chart, then tackles messy data, misleading dips, and ways to combine BBT with other fertility signals. You'll learn how to read your own baseline, why three consecutive higher temperatures matter, and what to do when your chart doesn't form a neat plateau.
If you're also exploring broader, non-medical approaches to cycle wellbeing, you may find this resource on plant-based fertility support useful alongside evidence-based fertility education. It shouldn't replace clinical care, but it can sit within a thoughtful, whole-person approach.
Introduction Why Your Temperature Matters After Ovulation
Your thermometer shows a reading only slightly higher than yesterday. You may already have seen a change in cervical mucus, recorded an LH result, or reached the time ovulation usually occurs in your cycle. The number can look too small to explain what is happening.
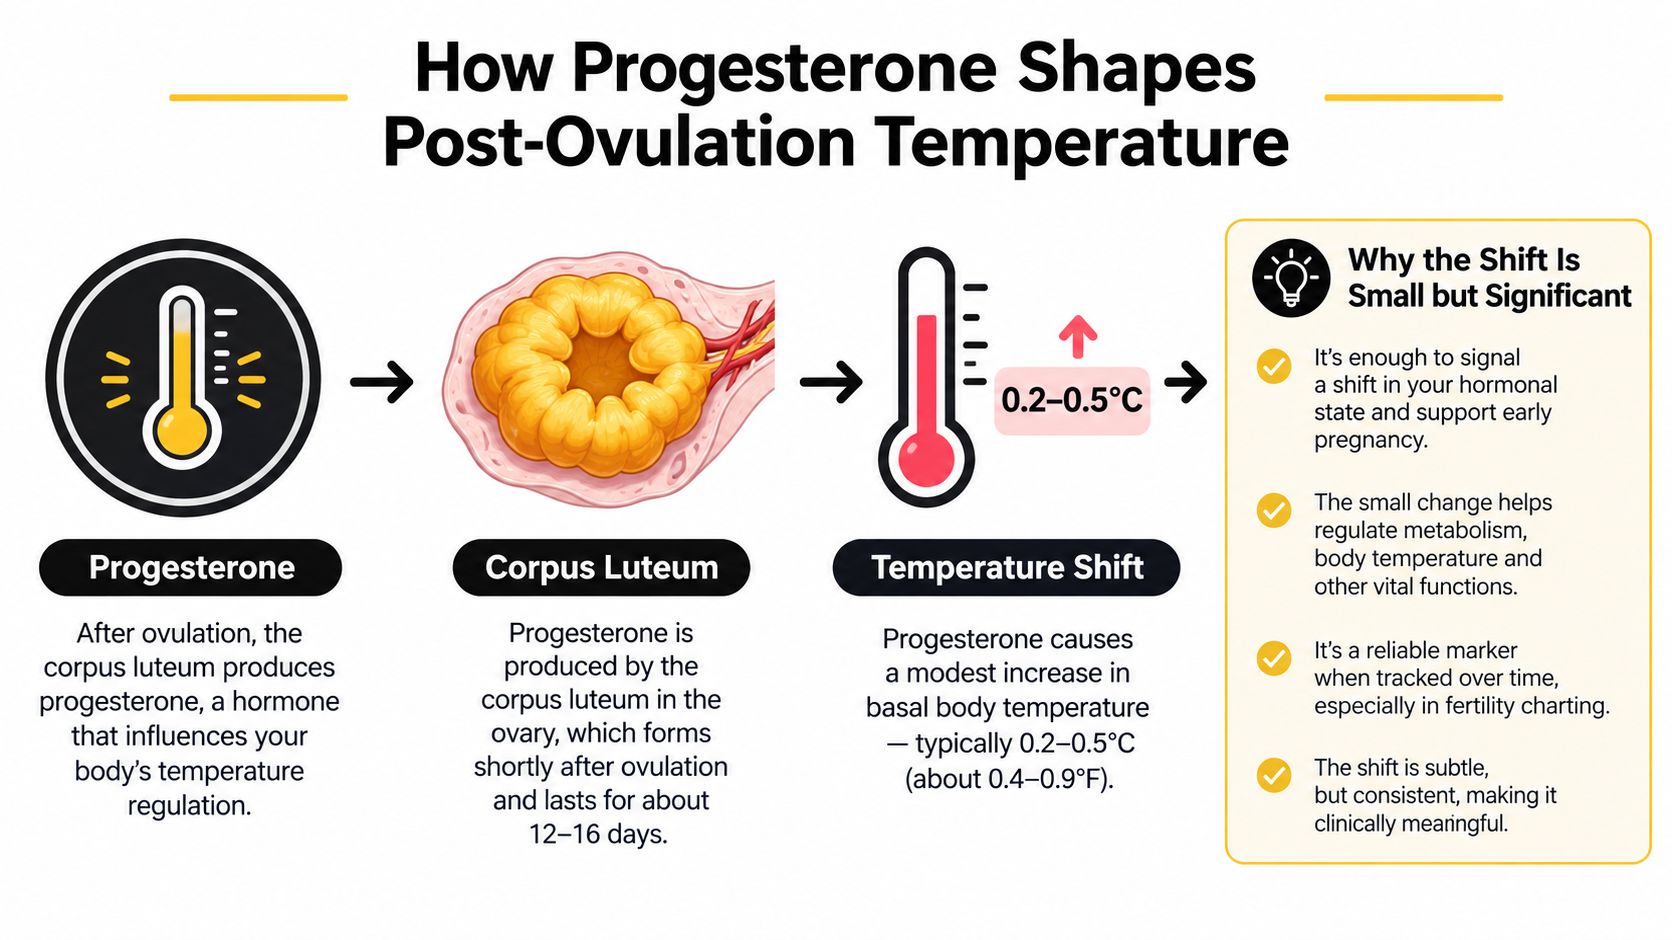
Resting temperature generally rises by 0.2–0.5°C after ovulation and remains higher until the next period, according to Australian fertility-awareness guidance (healthdirect guidance via NCBI Bookshelf). This is a modest shift, more like a thermostat moving one notch than a fever appearing. Its meaning comes from comparison with your earlier readings and from the pattern that follows.
Ask whether your chart has moved into a sustained higher pattern, rather than whether one temperature is high enough.
BBT is therefore mainly a confirmation tool. Because the rise follows ovulation, one higher reading cannot prove that ovulation occurred that day, and BBT alone cannot identify the fertile window in advance. Confidence increases when the change continues, commonly after three consecutive higher temperatures, as described in Family Planning NSW guidance.
A chart can still be useful when it is untidy. Poor sleep, illness, alcohol, a different waking time, or another disruption can make an individual reading noisy. Look for the overall direction instead of treating every dip as a message about implantation or every missing rise as proof that something is wrong.
This way of reading BBT supports people trying to conceive, practising fertility awareness, or learning their cycle patterns. Record conditions that might affect a result, compare readings with your own baseline, and use cervical mucus or LH tests when you need information that looks ahead. You may also find this resource on plant-based fertility support useful alongside evidence-based fertility education.
How Progesterone Shapes Your Post Ovulation Temperature
After ovulation, the follicle that released the egg becomes the corpus luteum. This temporary structure produces progesterone, which raises resting body temperature by a small amount. The change is usually measured in tenths of a degree, not as a fever or dramatic jump.
Progesterone from the corpus luteum raises the body's resting setpoint by a few tenths of a degree. Before ovulation, your readings usually sit within your own lower range. Afterward, the hormone shifts that range upward. BBT makes this change visible when you measure under reasonably similar conditions each morning.
Why consistency gives a small shift meaning
A few tenths of a degree can matter because BBT compares your readings with your own baseline. The comparison becomes clearer when your routine stays reasonably consistent.
Take your temperature immediately after waking, before getting out of bed, around the same time each day, and at the same body site. Measuring by mouth, vagina, or rectum can all be used, but changing sites makes readings harder to compare. Taking the temperature after several hours of rest and recording factors that may affect it also helps you interpret the chart.
Eating, drinking, sexual activity, being awake for a while, disrupted sleep, illness, and a different measurement site can all add noise. The goal is not laboratory perfection. It is a repeatable routine that allows the broader shift to stand out.
A digital basal thermometer may make that routine easier. The Venus Smart Basal Thermometer for Ovulation - Bluetooth BBT Tracker with App is described in its product information as a Bluetooth thermometer for BBT tracking, with automatic app syncing.
What progesterone can and can't tell you
Progesterone explains the higher readings, but BBT remains retrospective. The rise generally reflects a hormonal change that has already happened, so temperature is better for confirming a completed shift than for predicting ovulation in real time. The number itself matters less than whether readings form a sustained change from your earlier baseline.
For context about how progesterone changes may relate to symptoms or cycle patterns, see this guide to signs and symptoms of low progesterone. Questions about treatment require clinical advice; this practical guide on progesterone solo is general education rather than personal medical guidance.
This short video offers a visual explanation of the hormonal sequence:
What a Typical BBT Pattern Looks Like After Ovulation
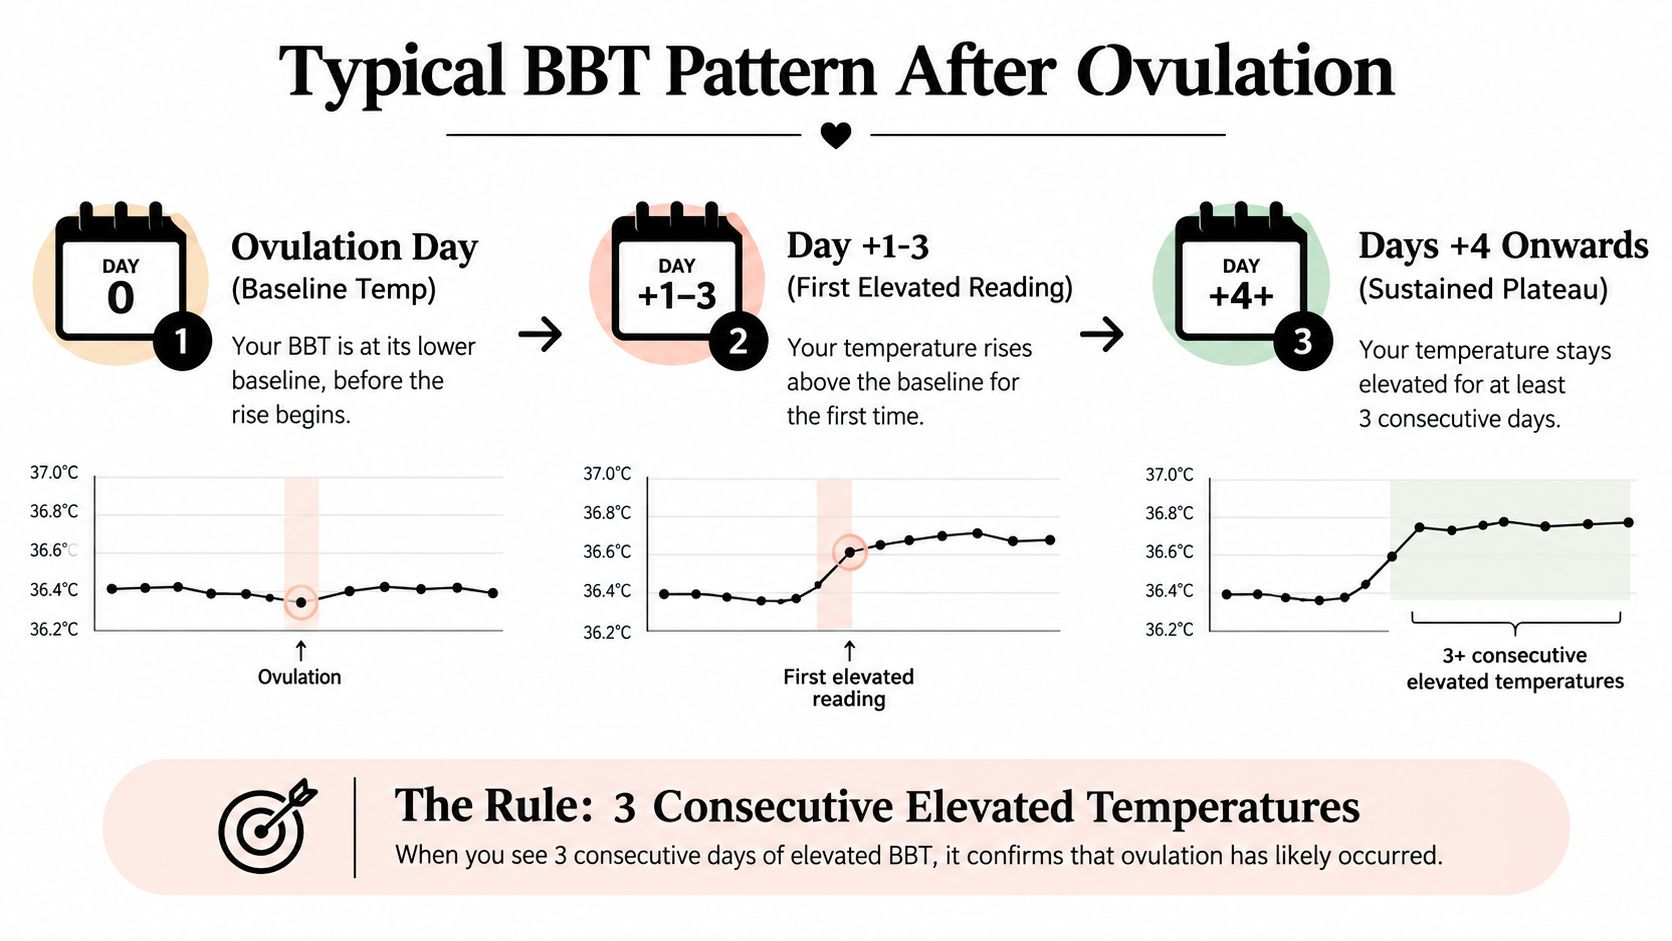
Your chart may look uneven at first. A lower reading appears near your usual baseline, then a transition begins, followed by several readings that sit higher than the earlier pattern. BBT works like a rear-view mirror here. It can help confirm that a shift has occurred, rather than predict ovulation as it happens.
Reading the pattern across the days
On the suspected ovulation day, your temperature may still be close to baseline. That reading is not a definitive answer because the temperature shift usually follows the hormonal event.
The next morning may bring the first higher reading. It could be obvious, modest, or difficult to separate from normal variation. Treat it as a clue, not confirmation.
Look across the following mornings for continuity. Three consecutive higher temperatures are commonly used as a practical sign that the fertile window has ended. The readings do not need to match. Their value comes from forming a sustained change relative to your earlier baseline, not from reaching one fixed number.
Post-ovulation temperatures generally stay above the earlier pattern until the next period, reflecting the progesterone-supported luteal phase. A later fall can occur as the cycle changes, while small day-to-day movements may still appear within the higher phase.
Compare with your baseline, not somebody else's chart
Two people can have different usual temperatures and show the same type of ovulatory shift. An absolute number has little meaning by itself. Compare each reading with your own earlier chart, like checking a new shoreline against your usual tide mark.
Ask:
- Is there a visible change? Look for a group of readings above your recent pre-ovulation pattern.
- Does it persist? Three higher readings provide more information than one isolated spike.
- Were the readings comparable? Check the usual measurement time, site, sleep conditions, and resting state.
For practical measurement instructions, use this basal body temperature guide for ovulation. Consistent technique makes a noisy chart easier to read, although it cannot remove every fluctuation.
A useful chart does not form a perfect staircase. It shows a recognisable shift that remains visible despite ordinary small variations.
Common Misunderstandings About BBT After Ovulation
A morning temperature can look decisive, especially when it rises above your usual readings. BBT works more like a trail of clues than a verdict. The useful question is whether several readings form a shift from your own baseline.
Myth one, a single high reading proves ovulation today
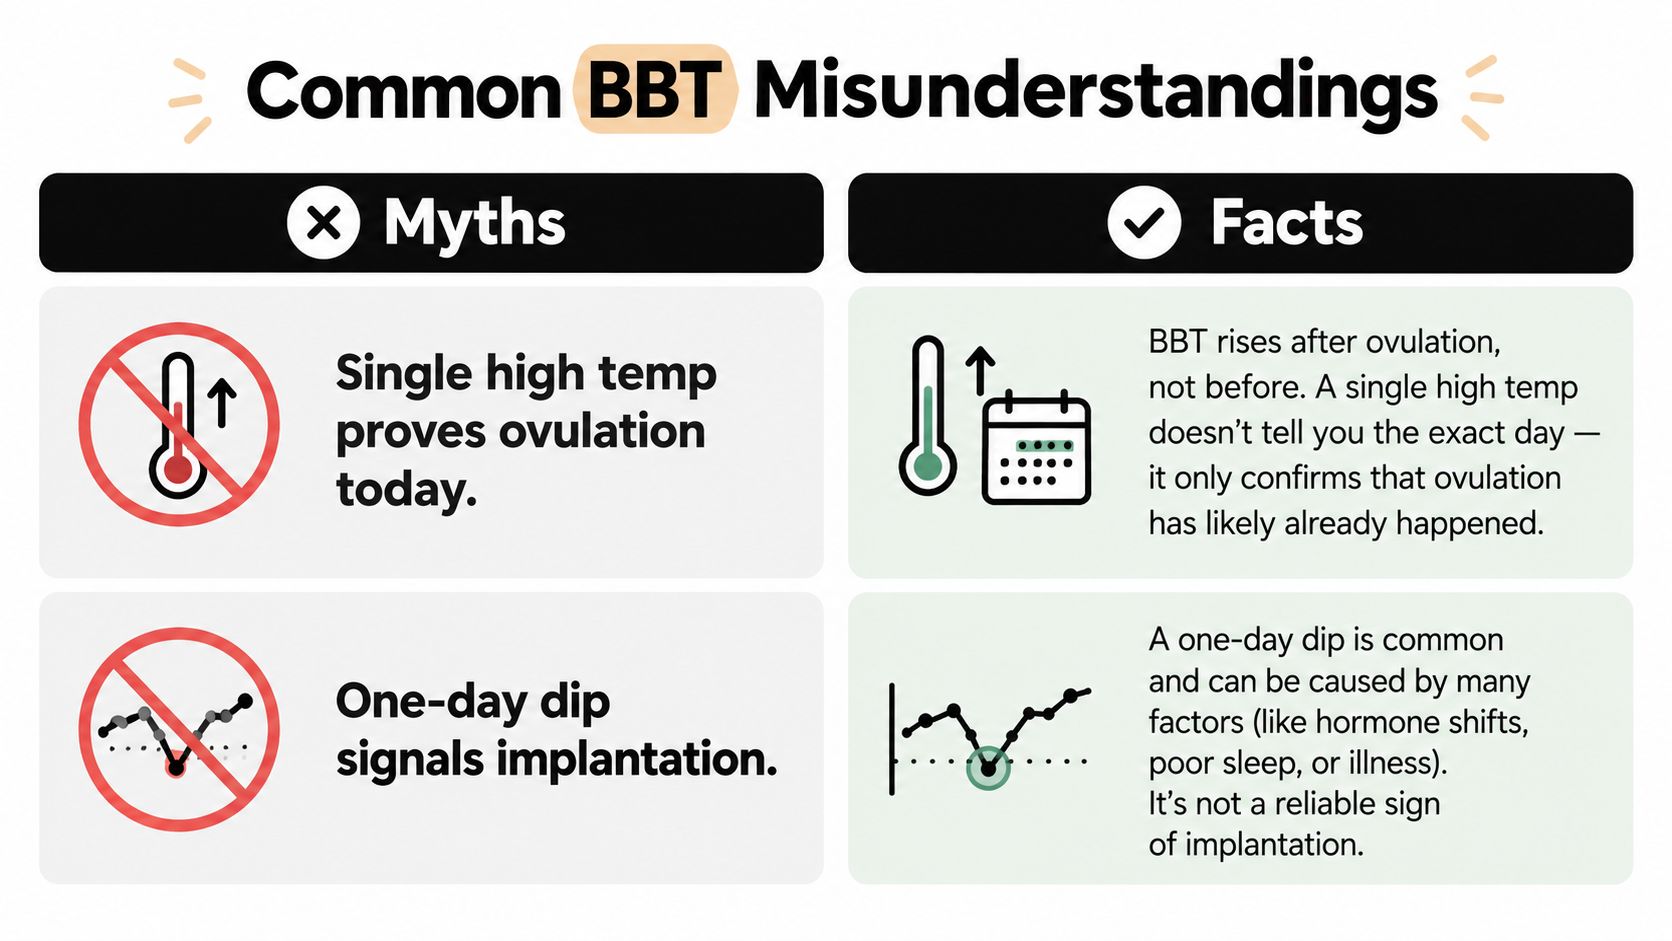
One elevated temperature may reflect a sleep change, illness, alcohol, a different wake time, or inconsistent technique. Even a progesterone-related rise usually confirms a change that has already occurred. It does not show that ovulation is happening at that exact moment.
One high temperature is an observation. A sustained pattern is evidence of a phase change.
As noted earlier, BBT is mainly retrospective. There is no universal Celsius threshold that proves ovulation for everyone. A shift of about 0.2–0.5°C can support the interpretation, but only when compared with consistent readings from your own earlier cycle (healthdirect guidance via NCBI Bookshelf).
Myth two, a one-day dip signals implantation
A one-day drop is non-specific. Measurement conditions, interrupted sleep, or ordinary cycle variation can create it. Fertility guidance does not treat an isolated dip as proof of implantation or pregnancy.
A dip followed by a higher reading may stand out on the chart, but BBT cannot establish what caused it. The same caution applies to a brief spike. Dramatic-looking movement is still only one data point.
The pattern-over-number rule
For example, readings of 36.3°C, 36.4°C, 36.6°C, and 36.6°C under similar conditions suggest a shift more clearly than one isolated 36.8°C reading.
That pattern can support a likely post-ovulation phase, but it cannot promise pregnancy, confirm implantation, or identify the exact ovulation time. When a chart looks noisy, return to the surrounding readings and the conditions in which they were taken.
When Your Chart Does Not Follow the Expected Pattern
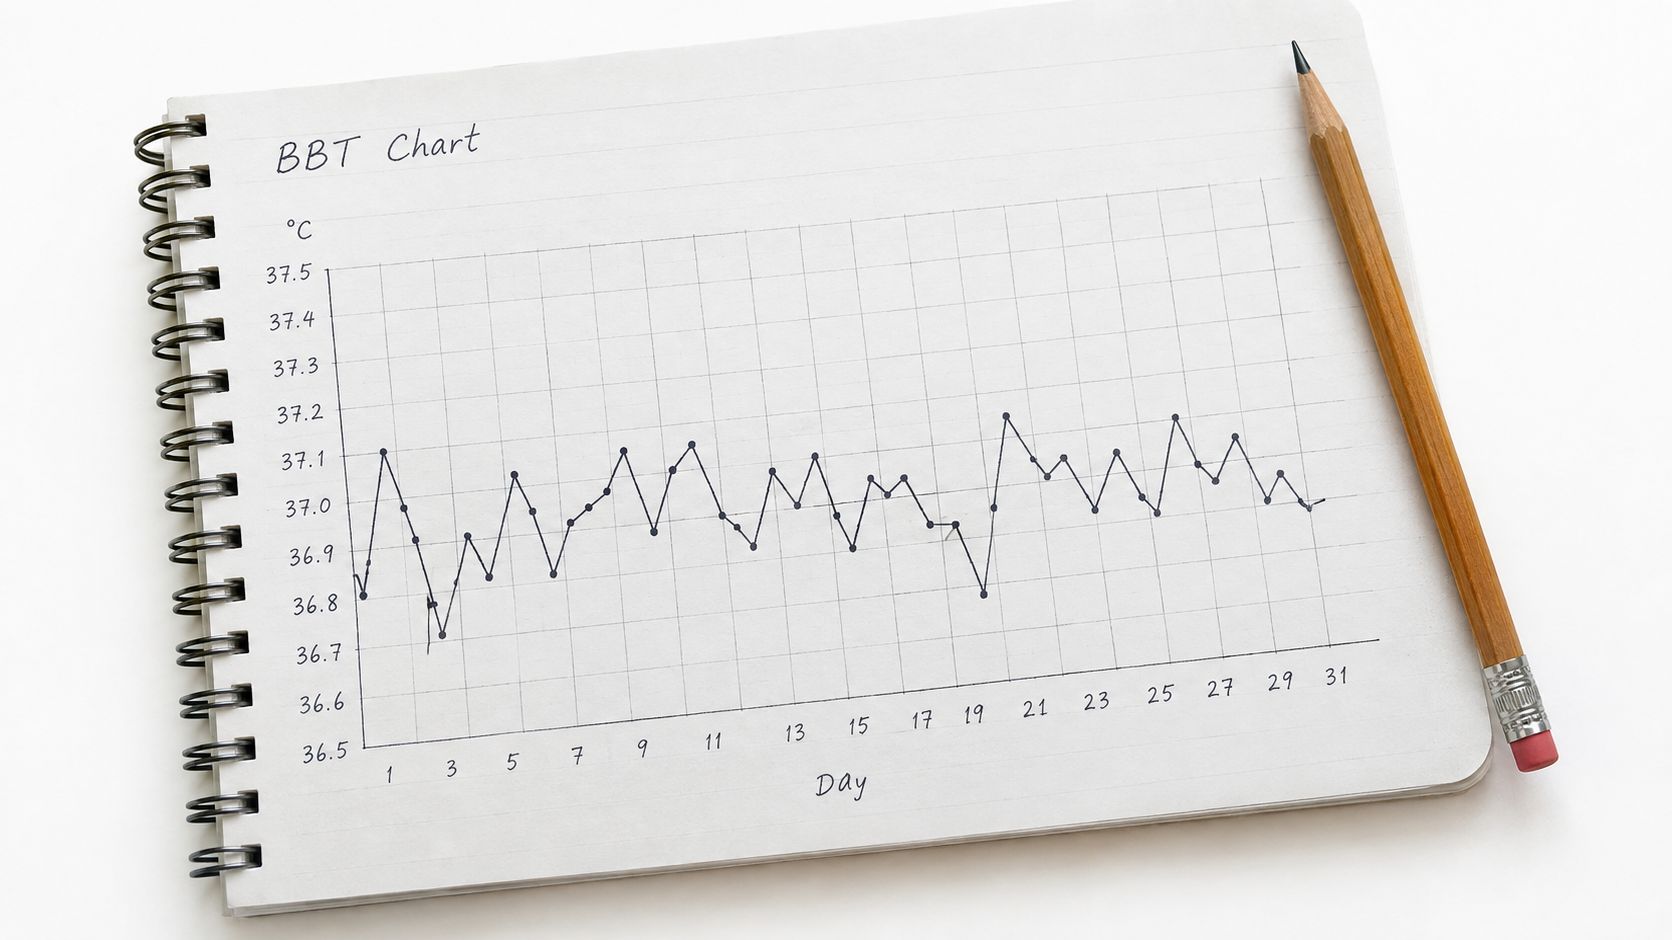
Real charts rarely look like tidy textbook curves. You may see no obvious rise, a rise that appears later than expected, or a higher phase that moves up and down. Before interpreting the cycle, inspect the measurement conditions.
If the rise is delayed
A delayed rise doesn't automatically mean something is wrong. The change may appear a day or two after the suspected ovulation date, or the earlier reading may have been affected by a late wake-up, interrupted sleep, illness, or a different measurement site.
Write a note beside the reading rather than deleting it. Record the wake time, sleep quality, symptoms, illness, alcohol, and any change in technique. One unusual value is often more useful as a flagged data point than as a reason to redraw the entire chart.
If the plateau looks jagged
A post-ovulation phase can still contain movement. Small fluctuations don't cancel the broader pattern if the readings remain generally higher than the pre-ovulation baseline. The more important question is whether the chart has a sustained higher grouping, not whether every morning matches the previous one.
Australian guidance emphasises measuring immediately after waking, before getting out of bed, after adequate rest, and preferably at the same time each morning. Routine changes can matter because the expected thermal shift itself is modest.
Use this troubleshooting sequence:
- Check the clock. Note whether you woke earlier or later than usual.
- Check rest. Mark broken or shortened sleep.
- Check the body. Record illness or anything that made the reading atypical.
- Check the method. Confirm that the thermometer and measurement site were consistent.
- Check the pattern. Keep charting before deciding that ovulation wasn't confirmed.
If there's no clear rise
A missing rise can have several explanations, including inconsistent measurements, noisy data, or a cycle in which ovulation hasn't occurred yet. BBT alone can't explain which one applies. Continue recording under consistent conditions and consider another fertility signal if timing matters.
If the absence of a rise repeats across cycles, or if you have ongoing concerns about irregular bleeding, cycle length, pain, or fertility, discuss the pattern with a qualified clinician. A chart is useful information for that conversation, but it isn't a diagnosis.
Using BBT With LH Tests and App Tracking for Clearer Insights
BBT answers a backward-looking question: has a sustained post-ovulation temperature shift appeared? An LH test can help with a forward-looking question: might ovulation be approaching? Combining them gives you a more useful timeline than relying on either signal alone.
An LH result doesn't replace BBT, and BBT doesn't replace LH testing. They measure different parts of the process. For a closer look at timing after an LH surge, read this guide on how long after an LH surge you ovulate.
The Venus Ovulation Predictor Test Kit is described in its product information as an at-home LH strip designed to identify the fertile window before ovulation, with results intended to be read within the stated test instructions. It can be used alongside BBT records rather than as a substitute for them.
BBT versus combined tracking methods
| Method | What It Tells You After Ovulation | Best Use |
|---|---|---|
| BBT alone | Whether a sustained higher temperature pattern may have appeared | Retrospective confirmation |
| LH testing alone | Whether an LH surge has been detected | Anticipating a potentially fertile period |
| BBT plus LH | Whether a likely pre-ovulation signal is followed by a higher temperature pattern | Prediction plus confirmation |
| BBT, LH, symptoms and cervical mucus in an app | How several personal signals line up across the cycle | Organised cycle awareness and review |
Manual entry can introduce gaps, especially when you're tired or travelling. An app that receives readings automatically can reduce typing and make it easier to see the curve over time. Venus Health Co. describes its app-connected thermometer system as combining BBT with LH results, symptoms, and cervical mucus in one place, which can be useful for people who want a single record instead of separate notes and spreadsheets.
The technology doesn't remove uncertainty. It gives you a cleaner record to interpret. You still need to consider measurement conditions, the limits of BBT, and the difference between a likely fertile window and confirmed ovulation.
Next Steps When to Seek Care and How to Track With Confidence
A single unusual temperature is rarely enough to support a strong conclusion. A repeated pattern matters more, particularly when you have measured under similar conditions. BBT works best as a record for looking back and confirming a possible thermal shift, not as a promise about what will happen next.
Speak with a clinician if you consistently cannot identify a post-ovulation rise, repeatedly see only a very short higher-temperature phase, or continue to have irregular or concerning cycles. Bring your chart and notes about sleep, illness, wake times, measurement site, bleeding, symptoms, and fertility tests. Together, these details can help distinguish a measurement issue from a broader cycle concern.
A calm routine for your next cycle
Keep the process simple:
- Measure on waking. Take your temperature before getting out of bed, eating, drinking, or becoming fully active.
- Keep conditions consistent. Use the same site, thermometer, and approximate time each morning.
- Record context. Mark disrupted sleep, illness, alcohol, travel, and late or early waking.
- Read the trend. Look for a sustained shift compared with your baseline, not a perfectly level line.
- Add a predictive signal. Use LH testing or cervical mucus observations when you need information before the temperature rise.
A digital basal thermometer that records fine temperature differences can make chart review easier, while an app can keep information organised. If you are also tracking wider health measures, the Venus AI Smart Scale is described as a separate body-composition device that provides app-connected reports and health insights. It does not measure fertility or replace a basal thermometer.
Confidence comes from repeating a sensible process, not from forcing every reading to tell a story.
Use BBT for the job it can do well: reviewing whether a sustained thermal shift may have occurred and building a record for cycle awareness or a clinical discussion. A single number cannot predict ovulation, confirm implantation from a dip, or establish pregnancy without appropriate testing. Patterns, measurement context, and time provide a steadier basis for interpretation.
If you want your BBT, LH results, symptoms, and cycle patterns in one chart so you can read patterns instead of single numbers, visit Venus Health Co. to explore its app-connected fertility tracking tools. Begin with a consistent morning routine, then review the overall shape of your chart rather than chasing certainty in each reading.