

How to Take Basal Body Temperature for Ovulation Correctly
Dr. Adeyinka AdegbosinYou're lying in bed, alarm going off, wondering whether you can reach for your thermometer without ruining the reading. The answer depends less on owning an expensive device and more on what happens in those first quiet moments. Basal body temperature, or BBT, is useful because it captures your resting temperature before movement and daily activity change it.
The method can feel confusing at first, especially when one unusually high reading appears on your chart. BBT generally confirms that ovulation has already happened rather than predicting the exact day, so the most reliable interpretation comes from a consistent pattern, not one dramatic spike. Australian fertility-awareness guidance describes a thermal shift of about 0.2–0.5°C, followed by three higher readings, as the key pattern to watch (Australian BBT charting guidance).
The First Step Before You Pick Up a Thermometer
When your alarm sounds, keep the room dim and stay under the covers. Don't sit up, speak to your partner, check your phone, or reach for water first. Take the reading while your body is still at rest, then record it before starting the day.
That small sequence is the foundation of how to take basal body temperature for ovulation correctly. BBT isn't a clinical test that gives a verdict from one morning. It's a quiet daily ritual that becomes meaningful when the readings are collected under similar conditions and viewed as a curve.
Before you begin, make the routine easy to repeat. Keep the thermometer within reach, decide where you'll record the number, and choose one measurement site you can use throughout the cycle. If you're learning the basics, what basal body temperature means can help you understand why the timing and method matter.
Four habits make the chart useful
You'll get more from BBT tracking when you combine four simple habits:
- Prepare the bedside setup: Have the thermometer and your chart or app ready before sleep.
- Recognise the curve: Look for lower pre-ovulation readings followed by a sustained rise, not an isolated high number.
- Layer fertility signs: Record cervical mucus and LH test results alongside BBT.
- Mark disruptions: Note illness, alcohol, unusual sleep, travel, or any morning that didn't follow your routine.
A missed reading doesn't mean the cycle is wasted. Leave it blank or label it clearly rather than guessing. Honest charting gives you better information than a neat-looking chart filled with uncertain numbers.
Setting Up Your Bedside BBT Routine
Your first morning reading should happen before the day starts moving. Keep the thermometer within reach and measure within 30 minutes of the same waking time each day, before sitting up, talking, drinking, eating, checking your phone, or walking to the bathroom. Family Planning NSW fertility-awareness guidance recommends taking BBT immediately after waking and using the same time and body site throughout the cycle. Consistency gives the chart a stable reference point, much like measuring against the same mark on a ruler.
Choose a basal thermometer that displays two decimal places, such as 36.42°C rather than 36.4°C. The post-ovulation change can be small, and extra display precision makes a gradual pattern easier to recognise. A standard fever thermometer may round the reading too heavily for charting. This basal thermometer guidance from Venus Health explains practical differences between thermometer types.
Pick one measurement site
Oral, vaginal, and rectal measurements can all be used. Each site has its own usual range, so the reliable choice is the one you can use the same way throughout the cycle.
- Oral: Place the tip under your tongue and keep your mouth closed.
- Vaginal: Insert the thermometer about 2 cm, following the device instructions.
- Axillary: Underarm readings are less reliable and are best treated as a last option.
Changing sites mid-cycle can create a false temperature shift. A few tenths of a degree may reflect the new site rather than ovulation. Hold the thermometer in place for the full beep duration, or 60 seconds, whichever is longer.
If you prefer automatic recording, the Venus Smart Basal Thermometer for Ovulation, Bluetooth BBT Tracker with App is designed to measure BBT and sync readings to a phone app.
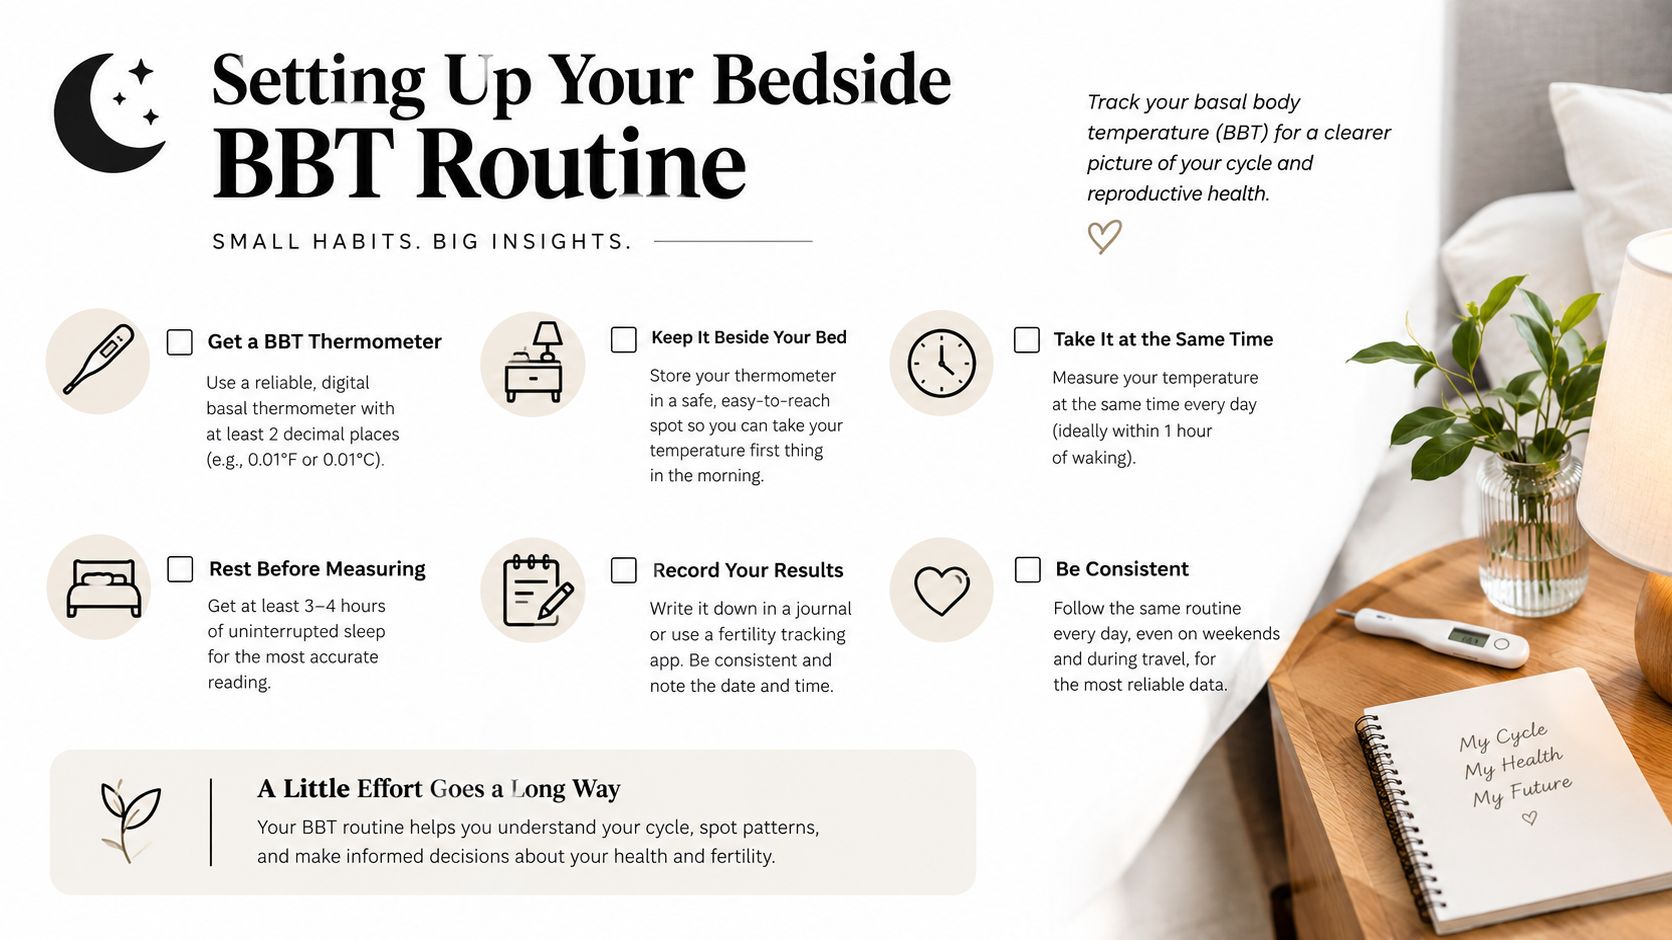
Your bedside checklist
Place these items where you can reach them without getting up:
- Thermometer, ready for use.
- Paper chart or charged app device, opened or nearby.
- Pen, if you record manually.
- Glass of water, but sip only after taking and logging the temperature.
Start a new chart on day one of menstrual bleeding, not spotting, as described in RACGP fertility-awareness clinical material. The early readings establish your personal baseline, so a single later spike should not be treated as proof of ovulation. Look for the sustained pattern instead.
What a Healthy Ovulation Temperature Pattern Looks Like
A healthy chart usually forms two broad levels. Before ovulation, Australian fertility guidance places many readings around 36.1–36.5°C. After ovulation, readings may sit closer to 36.5–37.0°C (Australian cycle temperature guidance). These ranges are reference points, not a pass-or-fail test. Your personal baseline may be higher or lower, so compare your readings with one another rather than with someone else's chart.
The important change is a sustained upward shift. A chart is biphasic when a lower phase is followed by a higher phase that continues for several days. A single spike can come from disturbed sleep, illness, alcohol, a warm room, or a different waking time. The pattern matters more than the tallest individual reading.
Apply the three-over-six rule
Start with the six earlier readings that best represent your lower baseline. Then look for three consecutive readings at least about 0.2°C above that baseline. This is the “three over six” pattern described in Australian BBT charting guidance.
The example uses a gradual dip followed by a rise. It demonstrates how confirmation develops, rather than showing what every cycle should look like.
| Cycle Day | Phase | Reading (°C) | Reading (°F) |
|---|---|---|---|
| 1 | Menstrual, lower phase | 36.3 | 97.3 |
| 5 | Lower phase | 36.2 | 97.2 |
| 12 | Lower phase | 36.1 | 97.0 |
| 14 | Possible dip | 36.0 | 96.8 |
| 15 | First higher reading | 36.4 | 97.5 |
| 16 | Second higher reading | 36.5 | 97.7 |
| 17 | Third higher reading | 36.6 | 97.9 |
| 21 | Sustained higher phase | 36.7 | 98.1 |
The reading on day 15 alone does not confirm ovulation. A hot flush, shortened sleep, alcohol the night before, or a warm bedroom could cause a temporary rise. The shift becomes more convincing when days 16 and 17 remain higher, completing the three-over-six pattern.
A higher phase indicates that ovulation has probably already happened. It cannot identify the exact day from the first increased temperature, so BBT mainly confirms ovulation retrospectively. Consistent wake times and the same measurement site help ensure that the apparent shift reflects your cycle, not a change in how the temperature was taken.
Logging Your Readings and Syncing Them With an App
A temperature needs context before it can help you interpret a cycle. Enter the reading promptly, then record the details that could explain an unexpected rise or fall. This turns a row of numbers into a usable record rather than a collection of isolated results.
Paper charts provide a quick visual overview and work well if you are comfortable writing each entry. A fertility app can reduce copying, display the temperature curve, and keep BBT beside LH tests, symptoms, and cervical mucus. An app cannot repair inconsistent measurements. It saves typing, not the need for a steady morning routine.
Capture five details every morning
| Field | Why It Matters |
|---|---|
| Temperature value | Shows the daily reading and the developing thermal pattern |
| Exact reading time | Helps identify changes caused by a different waking time |
| Measurement site | Prevents oral, vaginal, and other readings from being mixed |
| Sleep disruption | Explains a reading taken after restless or interrupted sleep |
| Alcohol or illness notes | Flags factors that may raise or distort the temperature |
Use plain language for cervical mucus, such as dry, sticky, creamy, watery, or slippery. Add LH test results to the same cycle chart. LH testing may indicate that ovulation is approaching; BBT helps show whether a sustained temperature shift followed. Together, they provide different clues rather than duplicate readings.
The Venus guide to BBT charts and app tracking explains how digital records can bring several fertility observations together. If you include urine LH testing, the Venus Ovulation Predictor Test Kit is described as an at-home test that provides results in under 10 minutes and is designed to identify the fertile window 24–36 hours before ovulation.
What Bluetooth changes
A Bluetooth basal thermometer can send a reading to an app automatically. That reduces manual transcription and avoids reading a small screen while half awake. The device still needs a charged battery, and pairing problems can interrupt the process.
After syncing, check that the value and time appeared correctly, then add information the thermometer cannot detect, such as poor sleep, alcohol, or illness. The app may make logging easier, but it cannot make a temperature reliable if the measurement conditions changed. Consistent entries give the chart a clearer foundation for interpreting the pattern later.
Mistakes That Quietly Ruin Your BBT Chart
The most damaging errors often feel harmless because they happen before the reading. Drinking water, sitting up, walking to the bathroom, or checking your phone changes the conditions you're trying to measure. Once you've started moving, the number may no longer represent your quiet resting baseline.
Keep the thermometer beside the bed and take the reading before any other activity. Log it before you drink the water waiting on your bedside table. If you've already got up, mark the reading as disrupted rather than treating it as equal to your usual measurements.
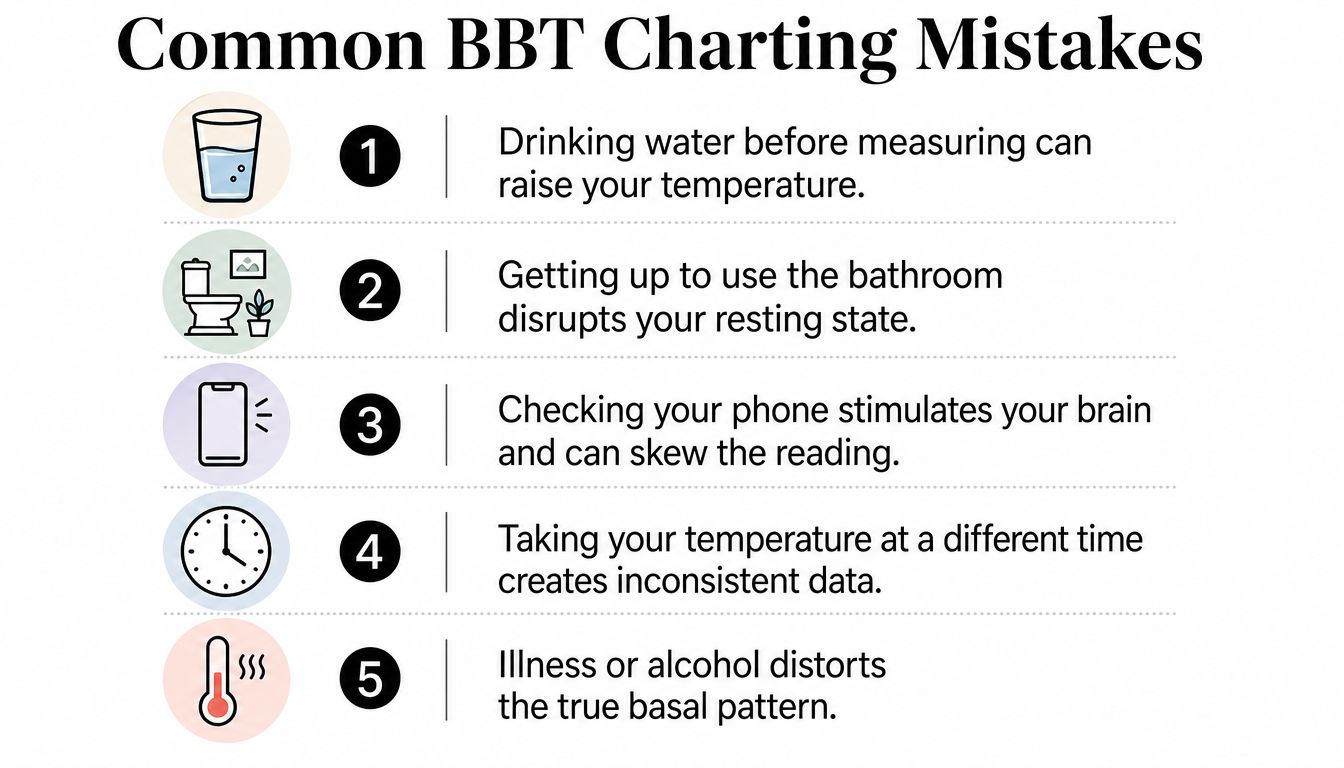
The errors to watch closely
- Different wake times: Weekend lie-ins and early work mornings can make the chart look more erratic. Aim for the same waking window whenever possible.
- Changing measurement sites: Oral, vaginal, rectal, and underarm readings aren't interchangeable. Choose one site and keep it consistent.
- Reading after activity: Sitting up, speaking, drinking, or checking your phone breaks the resting conditions.
- Ignoring illness or alcohol: Fever, feeling unwell, alcohol, and restless sleep can create a temperature that doesn't reflect your cycle phase.
- Calling ovulation too early: One high number is a clue, not confirmation. Wait for the three-over-six pattern.
Charting rule: If a reading has an obvious disturbance, label it. Don't erase it, secretly adjust it, or let it determine your ovulation day.
Inconsistent wake times deserve particular attention because they can produce false spikes and dips even when your hormones haven't changed. The same problem appears when you switch from oral to vaginal measurement, since the two sites can naturally show different values.
The safest interpretation is patient interpretation. Let several consecutive readings establish the direction. If the pattern remains unclear, use your cervical mucus and LH observations as supporting information rather than forcing one number to provide an answer.
Reading Your First Cycle and Knowing What Comes Next
At the end of your first cycle, a slightly uneven chart is normal. Start by checking the conditions behind each reading: was it taken before activity, at a similar waking time, and from the same measurement site? Then look for a lower baseline followed by a sustained higher phase.
A post-ovulation rise is often about 0.2–0.5°C. Use the three-over-six pattern as your guide: three consecutive higher readings compared with the preceding six lower readings. One isolated spike is only a clue. A sustained two-phase pattern supports ovulation, while an unclear chart is inconclusive rather than automatically abnormal.
Use the chart as a conversation tool
Take your records to a clinician if you repeatedly see no sustained rise, frequent unexplained disruptions, or a pattern you cannot interpret. Fertility-awareness methods require consistent daily measurement and careful interpretation, and BBT alone should not be treated as a real-time detector of ovulation or the only protection against pregnancy.
Use this framework when reviewing the chart:
- Clear pattern: Continue tracking when a lower phase is followed by a sustained rise.
- Unclear pattern: Check waking times, sleep, illness, alcohol, activity, and measurement site before drawing conclusions.
- Missing rise: Share the records with a healthcare professional if the absence persists or concerns you.
- Trying to conceive: Pair BBT with cervical mucus and LH observations. BBT usually confirms ovulation after it has occurred.
A common silent error is treating a single high number as the ovulation day. Hormones do not follow your app's prediction, and one disturbed reading can look like a breakthrough. Wait for the pattern, then compare it with your other observations.
Venus Health Co. offers an app-connected Bluetooth basal thermometer that can sync morning BBT readings. Its app can also store cycle information and fertility observations. Automatic syncing may reduce manual entry, but trustworthy interpretation still depends on consistent measurement and honest notes.
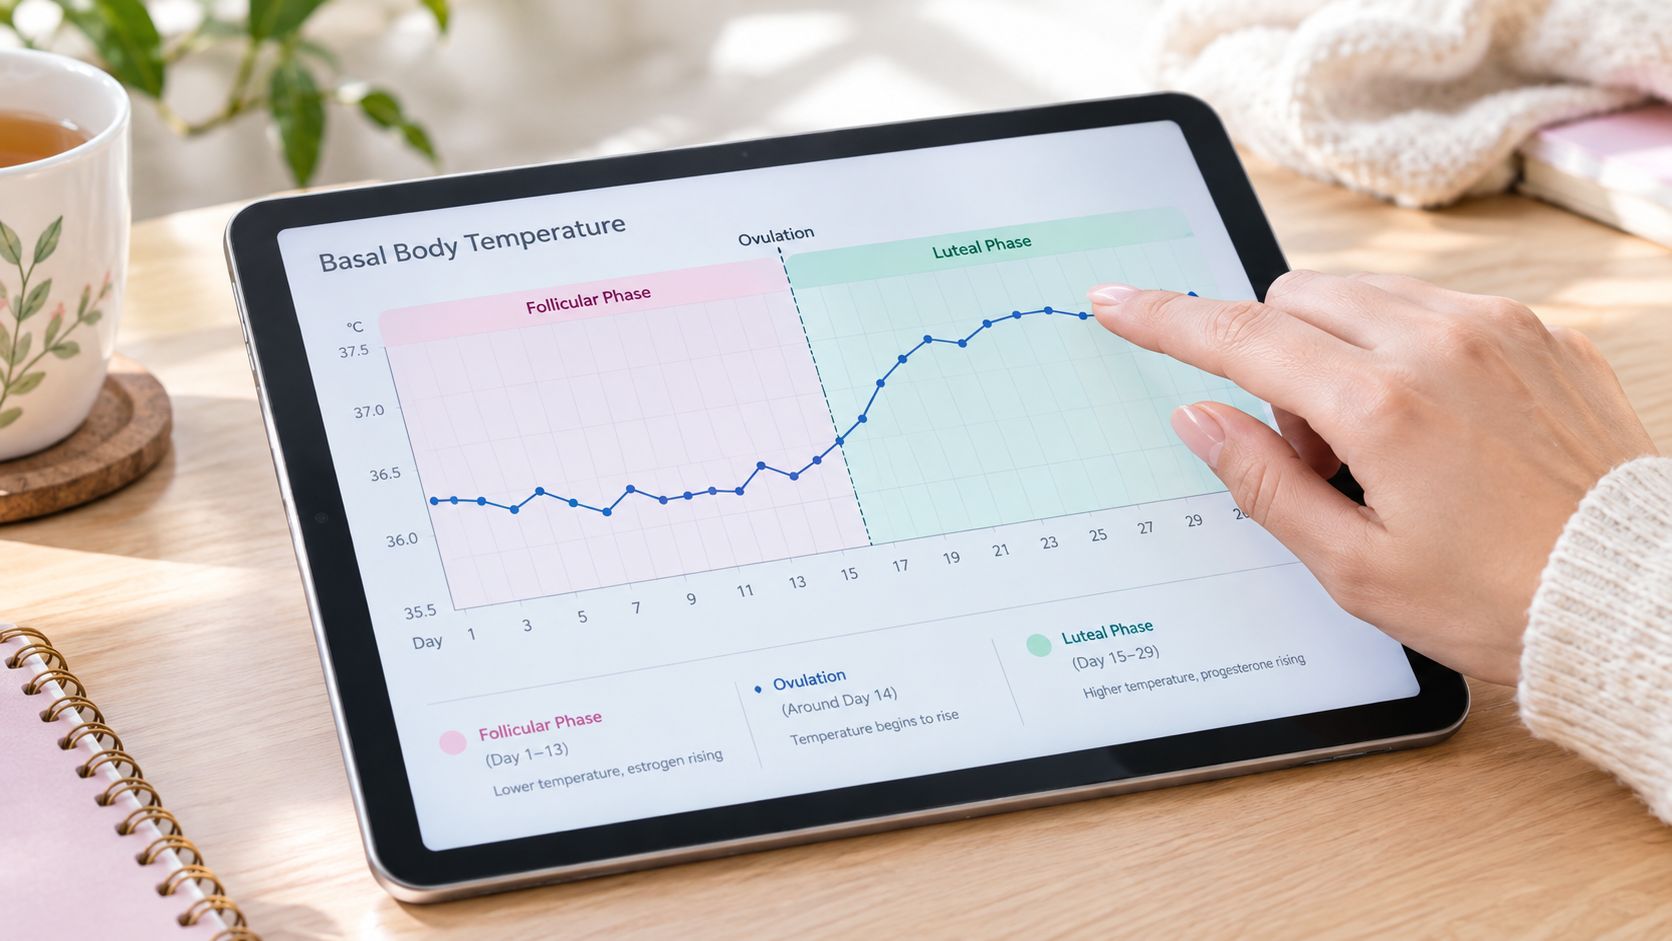
Start with one cycle and collect dependable readings instead of chasing a perfect ovulation date. After you learn your baseline, the chart becomes easier to read, and a clinician can assess persistent patterns with better context.
If you are ready to simplify the morning routine, explore the Bluetooth BBT thermometer and cycle-tracking tools from Venus Health Co.. Use the app to organise temperature, LH, symptoms, and cervical mucus data, then interpret the pattern rather than an isolated spike.