

Training Load Monitoring: A Practical Guide for Athletes
Dr. Adeyinka AdegbosinYou add a little more distance, another hard session, or an extra day of training because your goal matters. For a fortnight, everything feels fine. Then a knee, calf, shoulder, or Achilles niggle appears, and the next few weeks become about resting instead of progressing. The problem usually isn't a lack of motivation. It's a lack of feedback.
Training load monitoring gives you that feedback. It helps you see the work you've completed, how your body responded, and whether recovery is keeping pace. You don't need laboratory equipment, a sports-science degree, or a professional team budget. A phone, a simple effort scale, and a consistent weekly routine can reveal useful patterns.
Why Smart Athletes Track Their Training Load
A motivated runner often treats training like a test of character. If the plan says to run, the runner runs. If the legs feel heavy, they push through. If the last session went well, they add more because confidence is high.
That approach can work briefly, but it leaves one important question unanswered: what did the training cost your body? A five-kilometre easy jog and a five-kilometre run over hills may cover the same distance, yet they can create very different demands. The same workout can also feel manageable one week and unusually difficult the next, depending on sleep, illness, work stress, heat, and accumulated fatigue.
Australian Institute of Sport guidance formalises this idea for coaches and sports scientists. The AIS recommends combining internal load, external load, and sport-specific measures, while also reviewing recovery and athlete-response information to help manage loading and unloading phases (AIS training-load guidance). This isn't a fashionable app feature. It's a practical way to make decisions with better information.
The useful question isn't “Did I train hard?” It's “How much stress did that session create, and am I ready for the next one?”
Good training load monitoring teaches you six skills:
- Recognise the right metrics, without collecting every number your watch can display.
- Separate work from response, so you know what you did and how your body handled it.
- Understand adaptation, including why fitness improves only when recovery supports the training stimulus.
- Measure consistently, using a routine you can maintain at home.
- Interpret trends, rather than panicking over one poor session.
- Choose practical tools, from a handwritten diary to phone-based visualisations.
The aim isn't to remove effort or make training timid. It's to help you train hard when your body can absorb the work, and adjust before a small warning becomes a lost month.
What Training Load Monitoring Actually Means
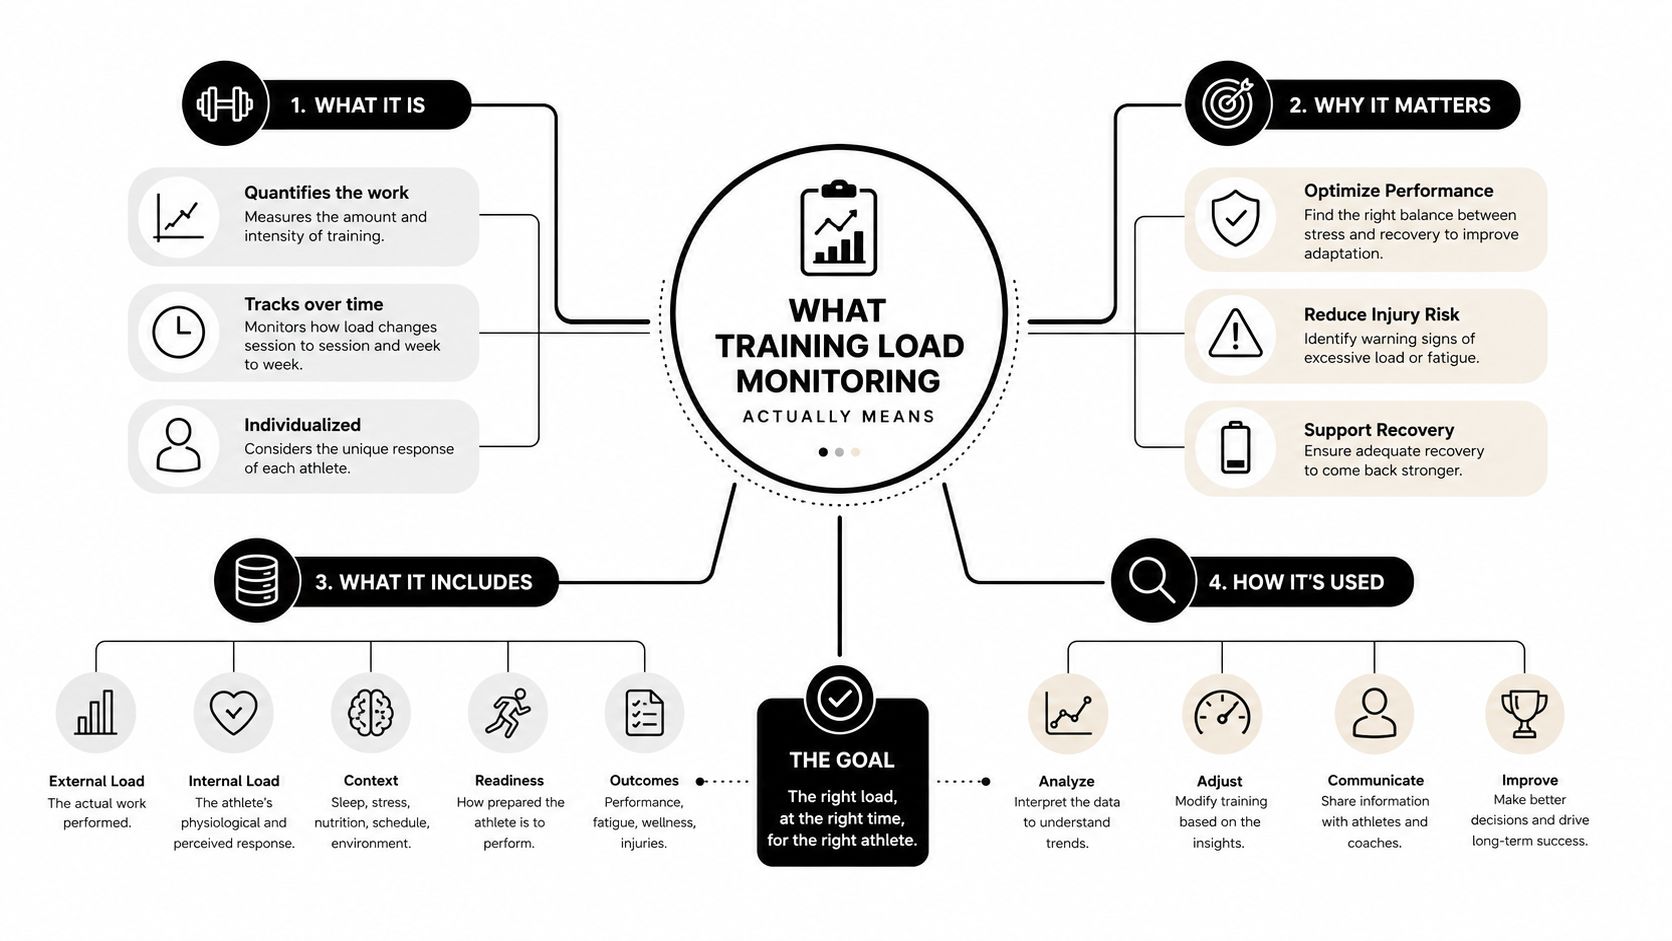
Training load is the total stress a training session places on your body. To understand it, split the idea into two parts.
External load describes what you did. It includes running time, distance, pace, repetitions, sets, power, speed, acceleration, and sport-specific actions. Internal load describes what that work cost you. It includes heart rate, perceived exertion, soreness, fatigue, mood, and other signs of your response.
Think of your fitness as a bank account. Each training session makes a deposit, because it provides a stimulus that can encourage the body to adapt. Recovery is the time required to process that deposit. Sleep, food, easy movement, and rest help restore the account. If you keep making large withdrawals without allowing the balance to recover, the account becomes overdrawn.
That analogy has an important limitation. Training isn't a matter of adding fitness points. A session may be a strong deposit, but it also creates a recovery bill. The body improves during the period after the stress, when it repairs tissue, restores energy, and adjusts to the demand. More training isn't automatically better if the recovery bill keeps growing.
External load and internal load
Suppose you cycle for an hour at a steady pace. The external record might include duration, distance, speed, and power. Your internal record might include heart rate, RPE, leg heaviness, and how alert you felt afterwards.
Now repeat the same ride after poor sleep or during a hot day. The distance and duration may remain similar, but your heart rate and perceived effort may rise. That difference matters. The external work stayed similar, while the internal cost changed.
The AIS specifically recommends collecting both forms of load and adding sport-specific metrics where possible. For a runner, that might mean time, distance, pace, and hills. For a field-sport athlete, it may include GPS distance, speed, acceleration, and match actions. The measure should reflect the demands that matter in your sport.
Why trends matter
A single reading is a clue, not a verdict. One high heart-rate reading may reflect heat. One low mood score may follow a difficult day at work. One hard session may have been harder than planned.
The AIS guidance recommends at least 28 consecutive days of daily load data before drawing firm conclusions about an athlete's load-management strategy (AIS training-load guidance). That gives you enough context to compare this week with your recent pattern. For athletes tracking other physiological patterns at home, the Venus Smart Basal Thermometer for Ovulation - Bluetooth BBT Tracker with App is designed to record basal body temperature each morning and sync readings to a phone through Bluetooth, though it measures reproductive physiology rather than training load.
Key Metrics and the Physiology Behind Them
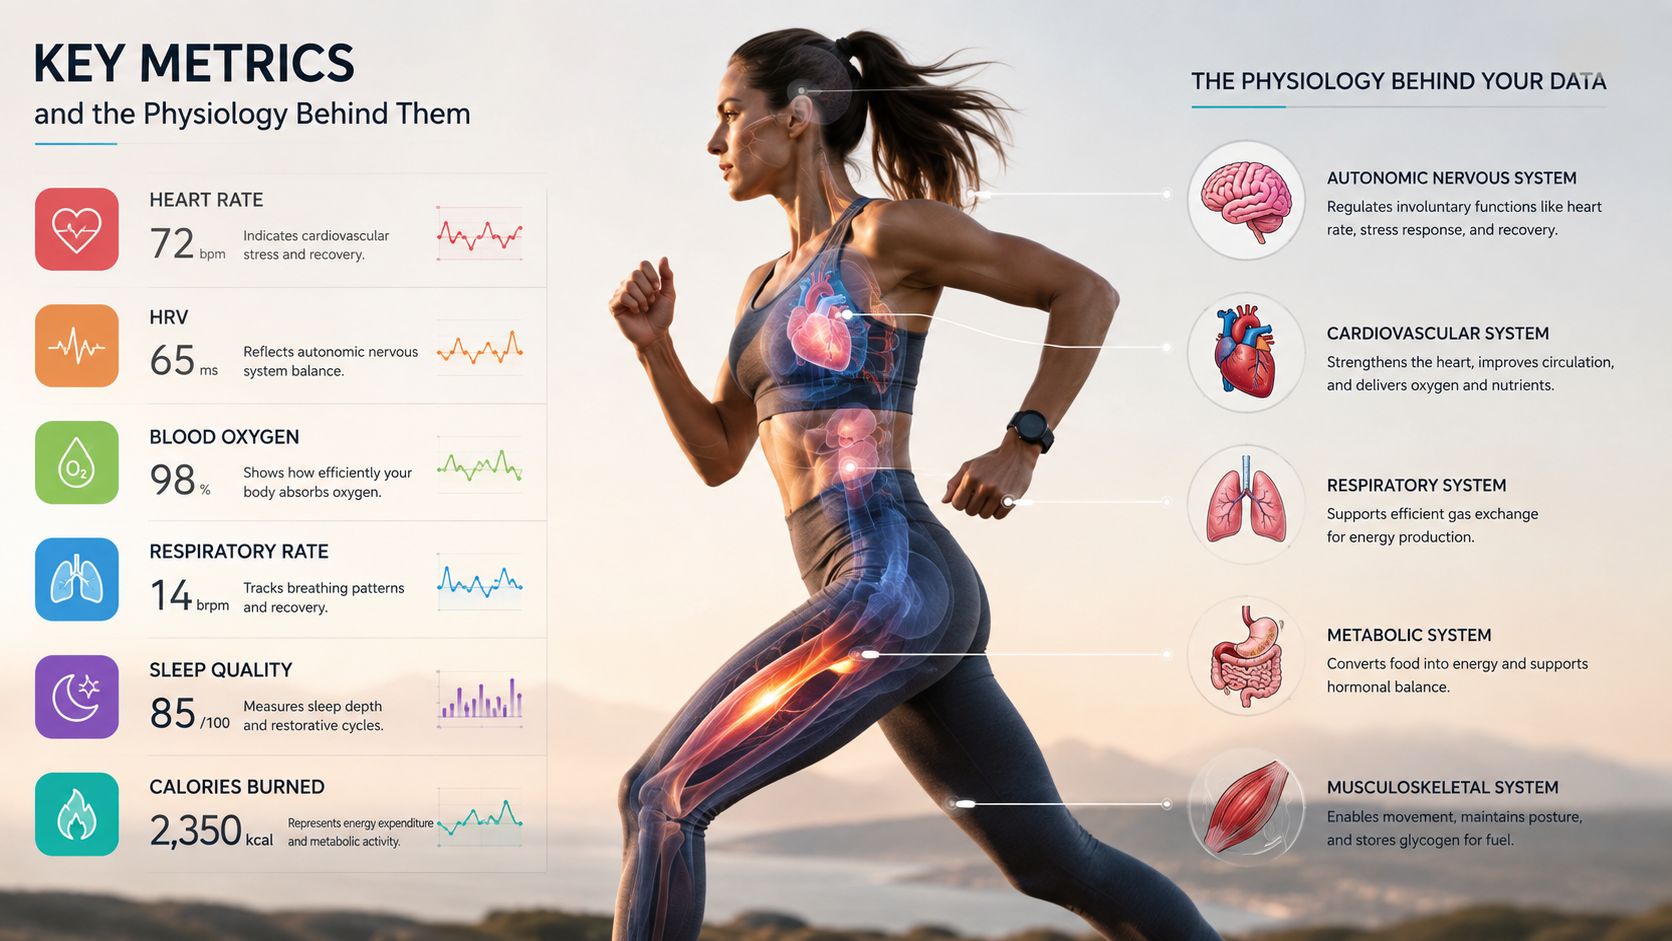
You don't need ten dashboards. Start with one load calculation, then add signals that answer a different question.
Session RPE
Session RPE is your rating of perceived exertion after training, usually on a scale from 1 to 10. Multiply the rating by the session duration in minutes.
For example, a 40-minute run that felt like a 6 out of 10 produces a session load of 240 effort-minutes. A 60-minute easy run rated 3 produces 180 effort-minutes. The calculation doesn't claim to measure every physiological detail. It gives you a repeatable estimate of the session's internal demand.
RPE reflects the combined experience of your cardiovascular, muscular, and mental effort. It can capture strength training, hill walking, or a session where a watch records external work poorly. Record it soon after finishing, before the hardest interval or final hill dominates your memory.
Heart rate
Heart rate adds another internal signal. A chest strap or reliable wrist sensor can show how hard your cardiovascular system worked, while trends can reveal that a familiar session is costing more than usual.
Heart rate isn't a direct measurement of muscle damage or readiness. Heat, hydration, caffeine, stress, and illness can all influence it. Use it alongside RPE rather than treating it as the final judge.
Distance, speed, acceleration, and power
These are external measures. Distance tells you how much ground you covered. Speed and pace describe how quickly you moved. Acceleration counts are especially useful in sports that involve repeated changes of speed. Power can help cyclists and some athletes quantify the work they produced.
The physiological reason for tracking external load is simple: your muscles, tendons, bones, and nervous system respond to mechanical work, not just to how hard the session felt. Australian football research supports combining objective measures such as distance, speed, acceleration, and heart rate with subjective feedback and RPE, because no single measure captures athlete adaptation well (University of Technology Sydney athlete-monitoring research).
Wellness markers
Each morning, record a few subjective markers:
- Sleep: how restorative the night felt.
- Soreness: where your body feels tight, painful, or unusually heavy.
- Mood: your general readiness and emotional state.
- Fatigue: whether normal training feels affordable or expensive.
These markers matter because life stress changes the internal load of training. A short session can be a large challenge when you're sick, under-recovered, or mentally drained.
If you're also monitoring body composition, the Venus AI Smart Scale: Body Composition & Body Fat Scale syncs measurements to the Venus Health App and provides weekly summaries, body-composition reporting, nutrition tracking, and an action plan. It can complement a training log, but it doesn't replace session load, recovery ratings, or sport-specific data. For broader context on interpreting composition data during training, see body composition for athletes.
How to Measure and Interpret Your Training Load
A runner finishes a demanding week and checks her log. The mileage looks familiar, yet her RPE has climbed, sleep feels poor, and her legs remain sore. Those details change the meaning of the week. Training load works like a fitness bank account: sessions make withdrawals, while sleep, food, and recovery help restore the balance.
Start with records you can maintain at home. After each session, note duration and session RPE, then multiply them to estimate effort-minutes. The calculation takes about half a minute. Consistency matters more than the design of the spreadsheet.
Each morning, record sleep quality, soreness, mood, and fatigue on a short scale. Add context for a late night, work pressure, illness, travel, or unfamiliar terrain. These notes explain why the same workout can create a different internal load on different days.
Read the weekly pattern, not one isolated number
Give the log enough history before drawing firm conclusions. The AIS recommends collecting at least 28 consecutive days of daily load data before making firm judgements (AIS training-load guidance). During that period, record every session, include a useful external measure such as distance or power when available, and review the week for rising effort, poorer recovery, or an abrupt increase in work.
The acute:chronic workload ratio compares this week's load with your longer-term pattern. In a simple weekly calculation, divide the current week's total by the average weekly total from the preceding four weeks.
For example, a recent four-week average of 400 effort-minutes and a current week of 480 produce a ratio of 1.2. That indicates work above the recent average. It does not, by itself, show whether the change is appropriate. Interpret it beside soreness, sleep, RPE, and the type of training completed.
Practical benchmarking in Australian team sports identifies roughly 0.8 to 1.3 as a target range and ratios of 1.5 or above as a higher-risk loading pattern (Australian training-load benchmarking research). Use these bands as prompts to review and adjust training, not as medical guarantees.
| Acute:Chronic Ratio | What It Means | Recommended Action |
|---|---|---|
| Below 0.8 | Recent work is lower than your established pattern | Maintain or rebuild gradually, especially after illness or injury |
| 0.8 to 1.3 | Recent work sits near the practical target range | Continue while checking wellness and session response |
| Above 1.3 and below 1.5 | Recent work is rising beyond the usual pattern | Review intensity, volume, terrain, and recovery before adding more |
| 1.5 or above | A higher-risk loading pattern | Avoid adding load, consider an easier session, and seek qualified advice if symptoms persist |
A daily record can shorten the delay between training exposure and adjustment. In Australian triathlon coaching practice, 81% of coaches reported using objective metrics, 43.5% monitored every session or day, and 51.6% monitored weekly (Australian triathlon coaching study). The findings illustrate why a small phone-based log can help an amateur athlete respond sooner. Football coaches assessing wearable options can compare EPTS systems, while a simple RPE record remains a practical starting point.
For athletes who separately track ovulation, the Venus Ovulation Predictor Test Kit is an at-home LH testing product with results designed to appear in under 10 minutes. Keep that information in a fertility record rather than adding it to the training-load calculation.
Practical Protocols and Sample Weekly Workflows
Sunday evening, an athlete reviews the past week on a phone. The log shows session duration, RPE, soreness, sleep, and an unexpectedly hard hill workout. Nothing looks alarming alone, but together the pattern suggests that Monday should maintain demand rather than add more. This short review turns training load into a weekly conversation with the body.
A self-coached athlete can keep the routine simple:
Monday morning
Record sleep, soreness, mood, and fatigue. Then review the previous week's total effort-minutes, session types, and unusual external demands such as travel, heavy work, or extra walking. Choose one direction for the new week: maintain, build, or reduce demand.
After every session
Write down the total training duration and one session RPE from 1 to 10. Add context that changes the meaning of the number, including hills, intervals, heavy lifting, heat, illness, or unexpected difficulty. Later that day, add one sentence describing how your body responded.
Sunday review
Compare the new total with your recent pattern. If you have enough history, calculate the acute:chronic ratio, then check whether RPE, wellness, and external measures agree. When they point in different directions, record the disagreement instead of forcing a confident conclusion. Adjust one variable for the next week rather than increasing volume, intensity, and frequency together.
A weekly log works like a bank account for fitness. Each session makes a deposit, while sleep, recovery, and life stress affect the balance. The goal is not to avoid every withdrawal, but to notice when spending is outpacing recovery.
The AIS guidance also supports regular review of validated athlete questionnaires and response measures. A solo athlete can copy that principle with a short phone form and a consistent check-in. If pain changes movement, persists, or worsens, involve a qualified health professional rather than relying on a dashboard.
A coach can run the same process with more communication. Collect objective information such as distance, speed, acceleration, heart rate, duration, or sport-specific actions. Pair it with RPE, wellness, soreness, mood, and perceived recovery. Review the completed work beside the athlete's response, then ask about travel, study, work, sleep, illness, and pain.
Decisions should be shared with the athlete and relevant coaching, medical, or performance staff. Record what was reduced, maintained, or progressed, along with the reason. As noted earlier, Australian coaching practice commonly combines subjective and objective information. Numbers describe the work, while the athlete explains the lived response.
Common Pitfalls and Smart Recovery Strategies
The most common mistake is treating one metric as a verdict. A watch says the run was easy, so you ignore heavy legs. Your pace is slower, so you assume fitness has disappeared. A single score can't explain the whole athlete.
The better approach is triangulation. Look for several signals pointing in the same direction. If RPE rises for familiar work, sleep deteriorates, soreness increases, and heart rate is also higher, reduce the next demand. If one score looks unusual while the rest of the picture is stable, record it and watch the trend before changing the plan.
Challenge the usual assumptions
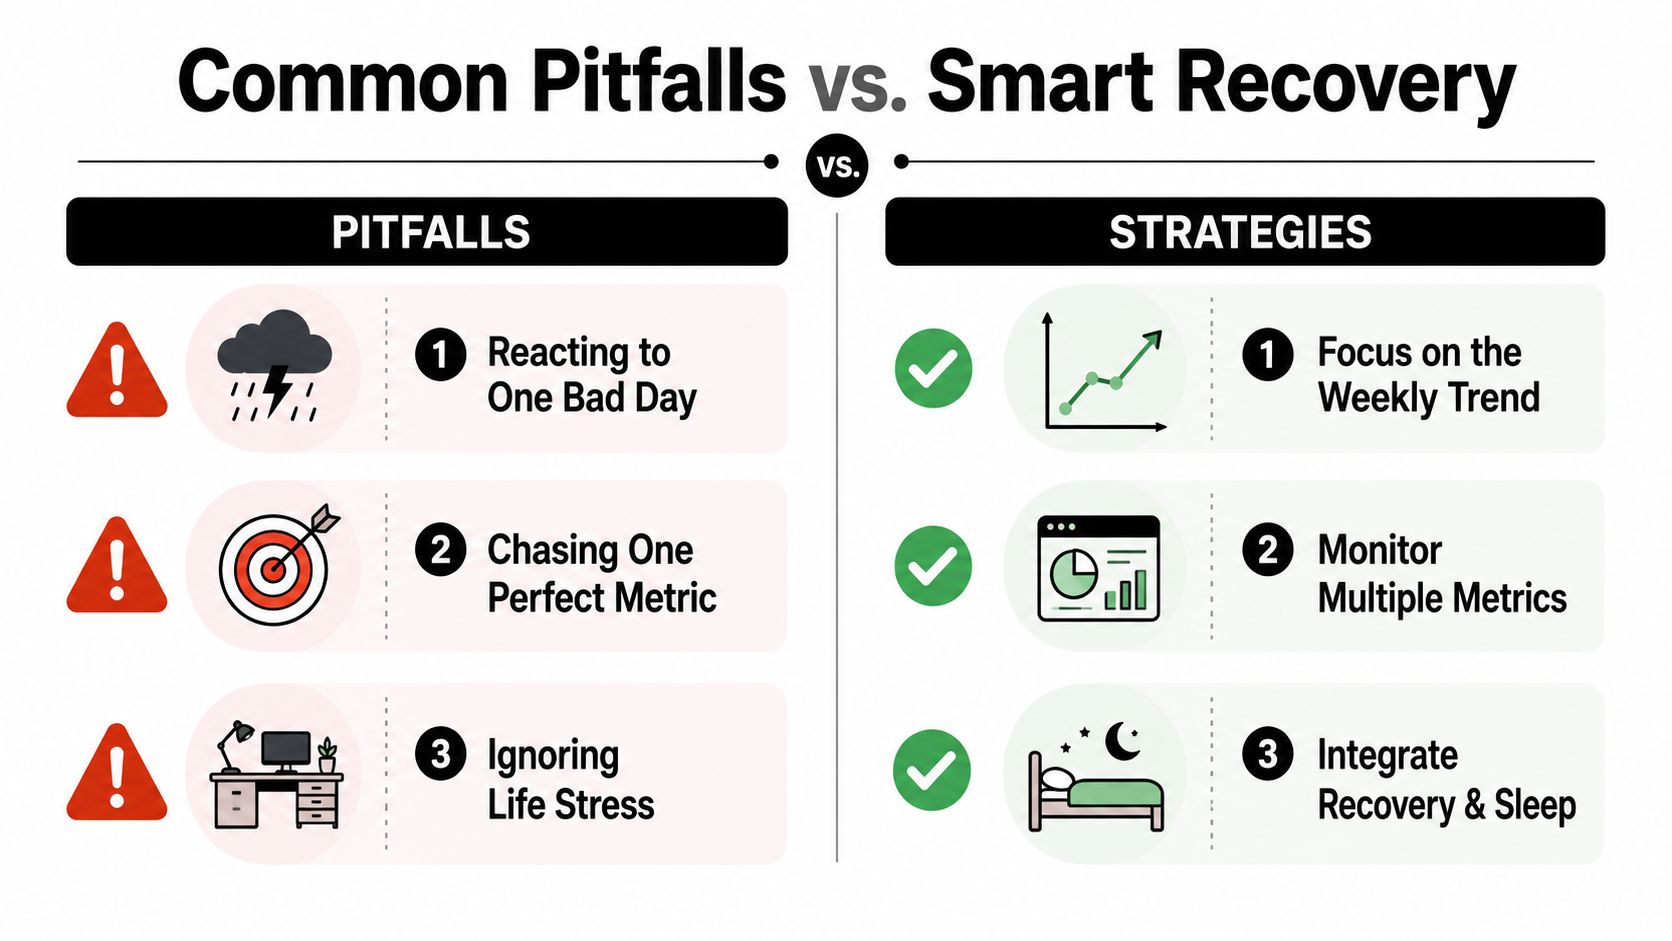
- Don't react to one poor day. A bad session may reflect heat, stress, or a poor night's sleep.
- Don't chase a perfect metric. Every measure is a proxy, so each has blind spots.
- Don't ignore life stress. Work, family pressure, travel, and illness add to the total internal demand.
- Don't let a good week trigger a jump. Feeling strong doesn't mean your tissues are ready for a sudden increase.
- Do compare like with like. A flat run and a steep trail session shouldn't be judged by distance alone.
- Do write down the reason for an adjustment. This helps you learn whether the change improved the response.
Practical rule: When several signals worsen together, respect the pattern before you respect the plan.
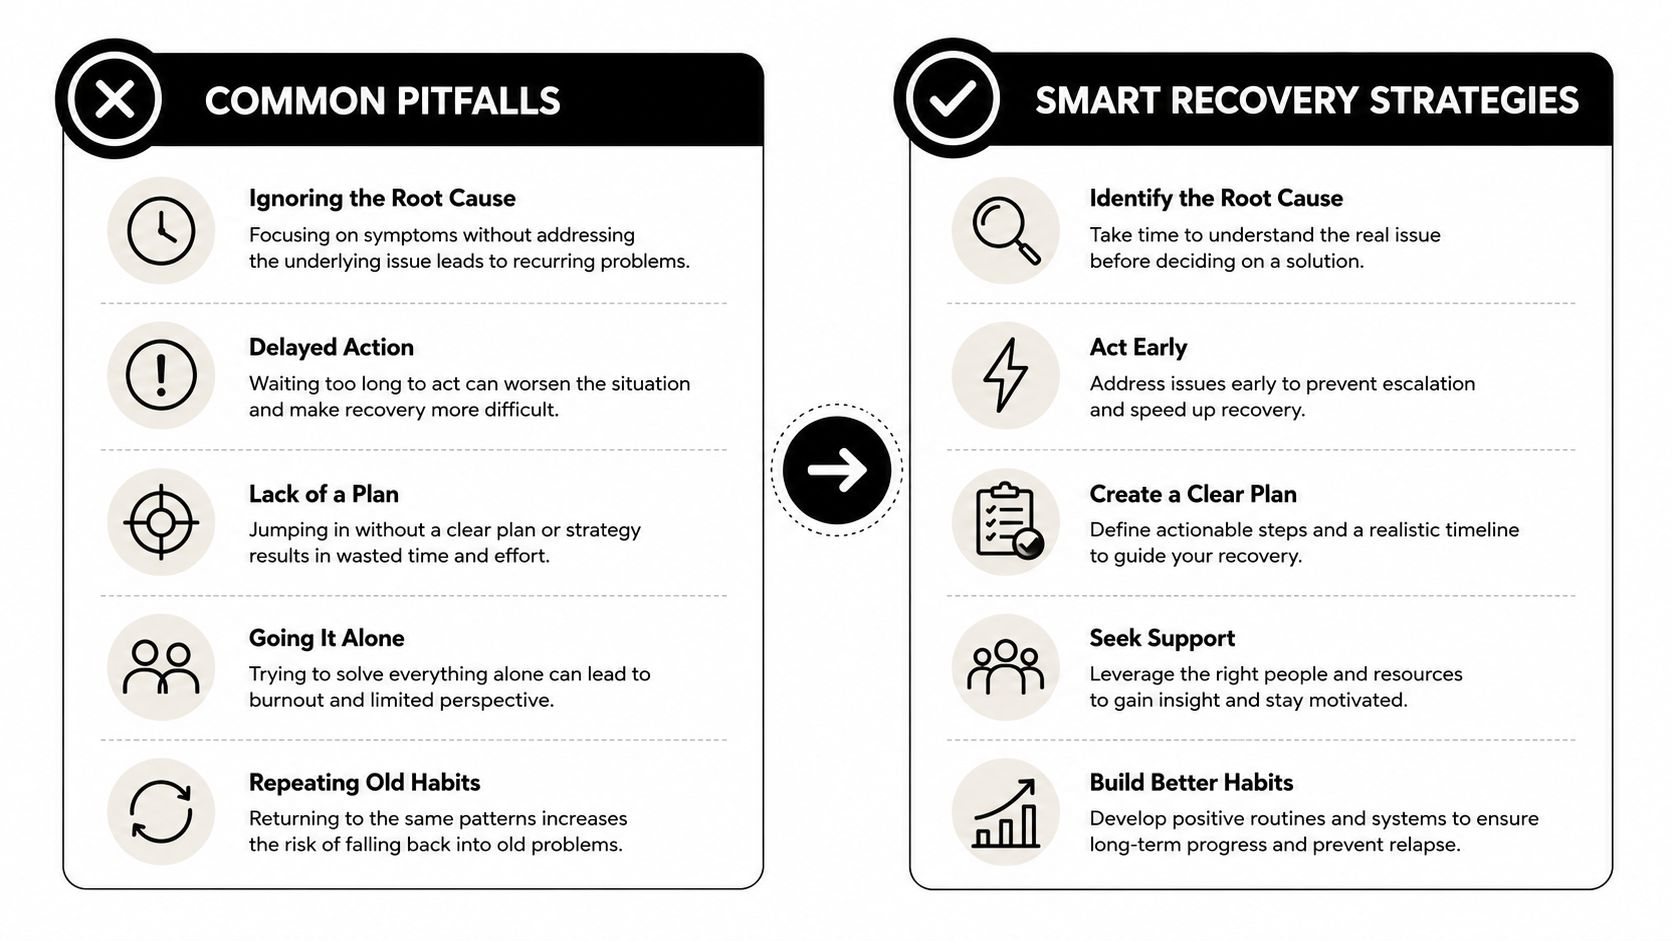
Recovery isn't passive. It's part of the training design. Keep easy days easy, protect sleep, eat enough to support the work, and schedule lighter periods before fatigue forces an unplanned break. The AIS has specifically warned that large week-to-week spikes can increase injury risk for up to one month after the spike (AIS training-load guidance).
A lighter week can reduce accumulated fatigue while preserving the habit of training. You don't need to earn recovery by becoming exhausted first. For a plain-language discussion of reducing excessive training stress, see overtraining prevention.
Bringing Load Monitoring Home With Visualisation and Apps
A useful visualisation answers a decision question. A weekly load bar helps you see whether work is rising. A rolling four-week line shows whether the current week is unusual. A wellness view can reveal that soreness and fatigue are worsening even when distance looks stable.
Avoid charts that only look impressive. A dashboard filled with colours, scores, and ring graphics can create more noise than insight if you don't know what action each chart supports.
Build a small home dashboard
Use three views:
- Weekly load bars: Display total duration multiplied by RPE for each week.
- Rolling four-week line: Compare the current week with your recent average.
- Wellness summary: Show sleep, soreness, mood, and fatigue together, using the same scale each day.
Keep the raw notes beside the graph. A sudden rise may make sense once you see that the week included hills, a race, or additional strength work. The graph identifies the question. Your notes help answer it.
App-connected tools can reduce manual entry for measurements outside the session itself. The Venus AI Smart Scale, for example, is designed for a weekly weigh-in, Bluetooth syncing, a six-page wellness report, body-composition analysis, nutrition tracking, and personalised action planning. Those data can complement training-load records by showing longer-term body trends, but they shouldn't be used as a substitute for RPE, external work, or recovery feedback. The product's reporting approach is described in how to make the best of Venus AI Smart Scale.
Your first week can stay simple:
- Record duration and RPE after every session.
- Log sleep, soreness, mood, and fatigue each morning.
- Add one sentence of context when training feels unusual.
- Review the week's pattern on the same day each week.
- Delay major conclusions until you've built at least four weeks of consistent data.
Training load monitoring is a habit, not a piece of equipment. Measure consistently, watch trends, respect the ratio, and compare several signals before you change direction.
Venus Health Co. offers app-connected tools for home health tracking, including a smart scale with body-composition insights and weekly summaries, plus a Bluetooth basal thermometer for automatic temperature recording. Visit Venus Health Co. to explore tools that can help you organise the wider health data surrounding your training routine.