

Muscle Percentage Women: What It Means and How to Track It
Dr. Adeyinka AdegbosinWomen's muscle percentage isn't one fixed “ideal” number. In the Australian study of 4,614 adults, women averaged 39% fat mass and 61% fat-free mass, while skeletal muscle declined by 11% to 15% from peak levels to age 75 and older.
So why do many conversations about muscle percentage women reduce the answer to a single scale reading?
Your muscle percentage is a moving body-composition measure, influenced by age, training status, hydration, nutrition, pregnancy and postpartum recovery, menstrual-cycle changes, perimenopause and menopause. The useful question isn't “Is my number good or bad?” It's “What does this number mean for my body, life stage and direction of change?”
That shift matters for Australian women balancing work, family, changing hormones and limited training time. A weekly trend can reveal progress that a one-off weigh-in hides, especially when fat mass and lean tissue change at different speeds. Keep reading to understand realistic reference points, how the number is measured, and how to improve your muscle percentage without making scale weight the centre of your life.
What Muscle Percentage Actually Means for Women
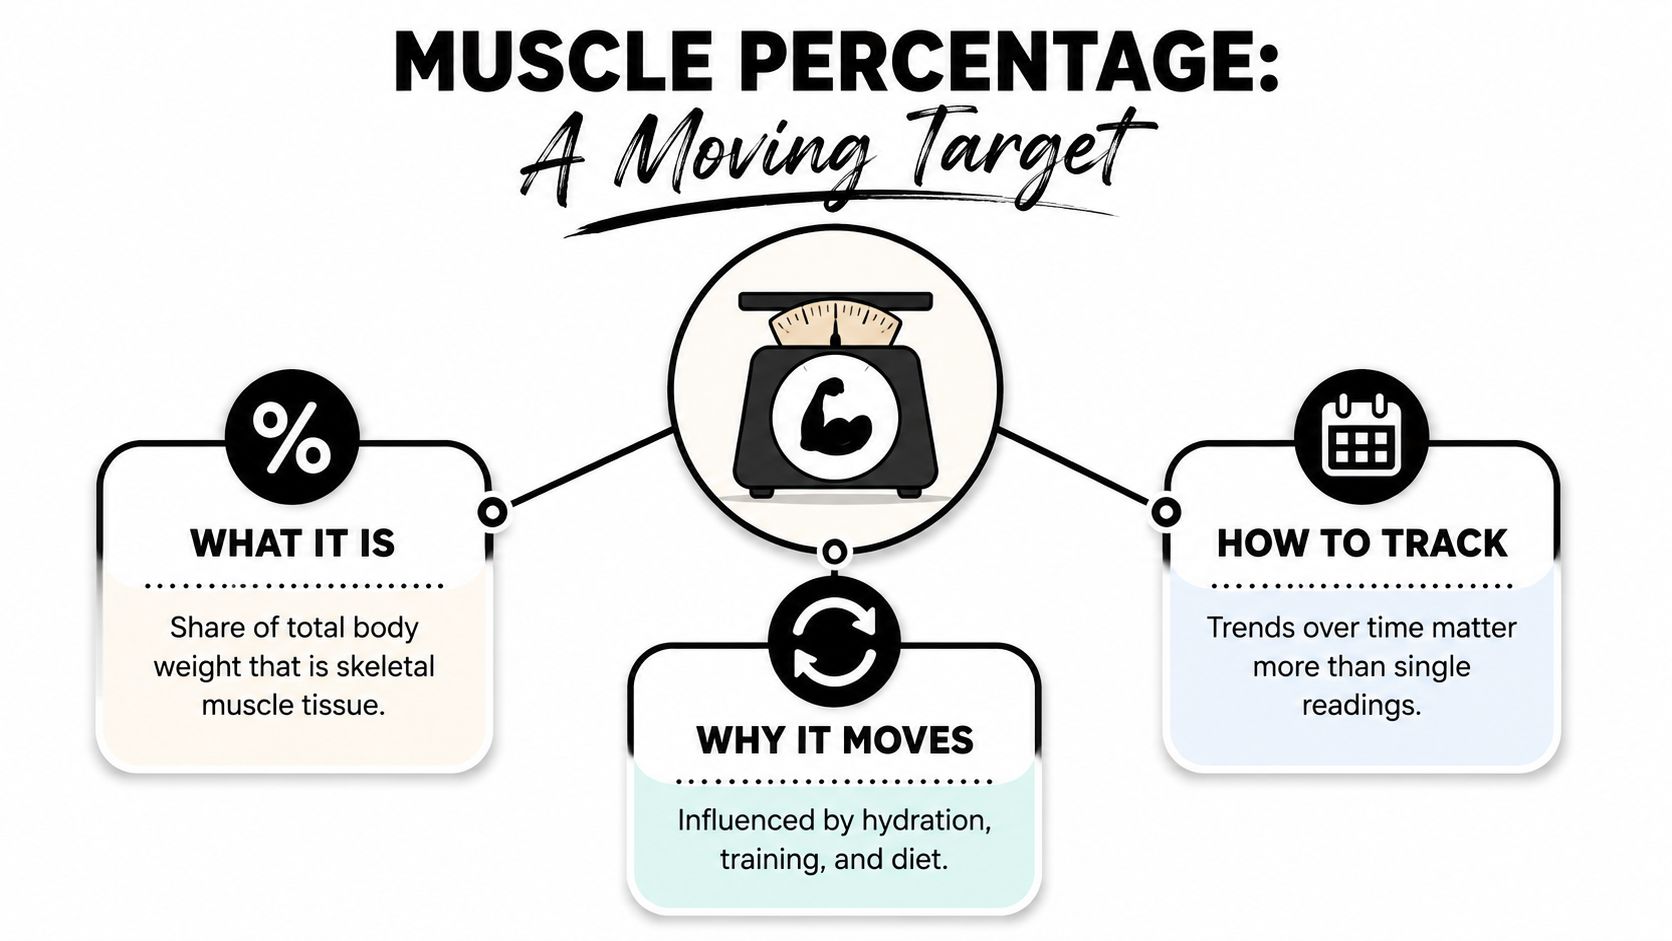
Muscle percentage is the share of your total body weight estimated to come from skeletal muscle, the voluntary muscle attached to your bones. It's the tissue you use to climb stairs, carry groceries, lift a child, stand upright and train with resistance.
Think of your body as a kitchen pantry. Your total body weight is the whole pantry, while skeletal muscle is one important shelf of ingredients. That shelf isn't a luxury item added only for appearance. It supports movement and physical capacity, and it needs regular use and replenishment. The pantry can weigh the same while the contents shift, with more fat, less muscle, more water or a different balance of lean tissues.
The first distinction to understand is that muscle percentage isn't the same as lean body mass. Lean mass, sometimes called fat-free mass, includes everything that isn't fat, including muscle, water, bone minerals, organs and connective tissue. A body-composition report may show lean mass increasing without proving that new muscle tissue has been built.
That's why a reading labelled “muscle mass” needs context. Different devices estimate different compartments using different models, and the number may not be directly comparable with a DXA result or a reading from another smart scale. The body composition guide from Venus Health offers useful background on how these measurements fit together.
Why women's readings vary
A woman's result can shift as her hydration, food intake, recent exercise and hormonal stage change. Pregnancy and postpartum recovery add another layer, because body water, activity, sleep and tissue demands may all look different from usual. Menopause can also change the relationship between muscle and fat, making an age-aware interpretation more useful than a universal target.
A supportive way to read the number is to treat it as information, not a judgement. If you want structured resistance-training guidance, you could also explore Spa Black's muscle toning program as one example of a programme focused on muscle development.
Practical rule: Use muscle percentage to ask better questions about your health, not to grade your body.
Healthy and Athletic Ranges Across the Life Stages
There isn't a verified Australian universal chart that can assign one healthy muscle-percentage band to every woman by age and training status. Australian evidence instead shows why interpretation must be local and age-aware. In the 2014 Australian Diabetes, Obesity and Lifestyle Study analysis, women averaged 39% fat mass and 61% fat-free mass, while men averaged 24% fat mass and 76% fat-free mass. Fat-free mass is broader than muscle, so those figures shouldn't be presented as direct muscle-percentage targets. The Australian study also found skeletal muscle mass and skeletal muscle index declined linearly from about age 25, with relative loss from peak to age 75 and older reaching 11% to 15%.
A separate Australian reference-range study used DXA data from 465 community-dwelling adults aged 20 to 94 to establish local benchmarks for the Hologic DXA system. Its findings show why age changes the meaning of a result, with lean-mass reference percentiles in women increasing by 3.1% at age 40, while fat mass also changed across adulthood. These are reference findings, not instructions to chase a particular percentage.
| Age Bracket | Sedentary | Recreationally Active | Consistently Training | Competitive or Athletic |
|---|---|---|---|---|
| Early adulthood | No universal Australian target | Interpret alongside body-fat and lean-mass data | Strength and performance may be more informative | Sport, genetics and method strongly affect results |
| Midlife | Look for gradual lean-mass maintenance | Track training consistency and recovery | Compare trends with strength progress | Use sport-specific assessment where appropriate |
| Perimenopause | Expect greater individual variation | Note cycle, sleep and recovery | Prioritise resistance training and adequate nutrition | Monitor performance, recovery and clinical context |
| Post-menopause | Focus on function and muscle preservation | Combine composition with strength markers | Track appendicular lean mass where relevant | Use professional assessment for specialised goals |
Life stage changes the question
Perimenopause and menopause aren't just age labels. They're periods when sleep, recovery, body-fat distribution and training tolerance may change. The practical aim is usually preservation and gradual improvement, rather than comparing a post-menopausal reading with a younger woman's result.
For a plain-language explanation of changes in fat and lean tissue during menopause, Lila's guide to mastering body changes in menopause can provide additional context. Cycle awareness can also help you annotate changes in appetite, energy and training readiness. If you're tracking ovulation, the Venus Ovulation Predictor Test Kit is described as a clinical-grade, at-home strip designed to identify the fertile window 24 to 36 hours before ovulation, with results available in under 10 minutes, according to its product information.
The key comparison isn't between your number and an athletic woman's number. It's between your current trend and your own previous trend, measured consistently and interpreted alongside age, life stage, strength and daily function.
How Muscle Percentage Is Measured and Where Each Method Falls Short
No consumer device weighs skeletal muscle directly. Each method estimates body compartments through a different process, so the most expensive option isn't automatically the most useful for weekly tracking.
DXA uses low-dose X-rays to estimate bone mineral, fat mass and lean soft tissue. It's commonly used for detailed clinical or research assessment, but it requires access to a scanning service and exposes you to a small amount of radiation. It's a useful baseline when you need a more detailed assessment, and you can read more about DXA scans and body fat.
Bioelectrical impedance analysis, used by many smart scales and handheld devices, sends a small electrical current through the body and estimates composition from resistance and body-water assumptions. It's convenient and suited to regular home readings, but hydration, recent food, exercise and skin temperature can affect the estimate.
Skinfold calipers, tape measurements and waist or hip measurements are inexpensive and practical. They don't measure muscle percentage directly, yet they can add useful context when combined with strength and weight trends. Hydrostatic weighing and Bod Pod testing offer specialist alternatives, but access varies and neither is a natural fit for most busy households.
| Method | Accuracy | Accessibility | Typical Cost | Time Needed | Key Limitation |
|---|---|---|---|---|---|
| DXA | Detailed clinical estimate | Clinic or imaging centre | Paid specialist service | Short appointment | Limited access and low-dose radiation |
| Hydrostatic weighing | Specialist estimate | Limited facilities | Paid specialist service | Appointment required | Uncomfortable for some users |
| Bod Pod | Specialist estimate | Limited facilities | Paid specialist service | Appointment required | Availability varies |
| Bioelectrical impedance | Useful for consistent trends | Home, gym or clinic | Device or service dependent | Very quick | Sensitive to hydration and conditions |
| Skinfold calipers | Depends heavily on operator | Widely accessible | Low-cost equipment or service | Quick | Technique affects results |
| Tape measurements | Practical size tracking | Highly accessible | Low-cost tape | Very quick | Doesn't identify muscle tissue directly |
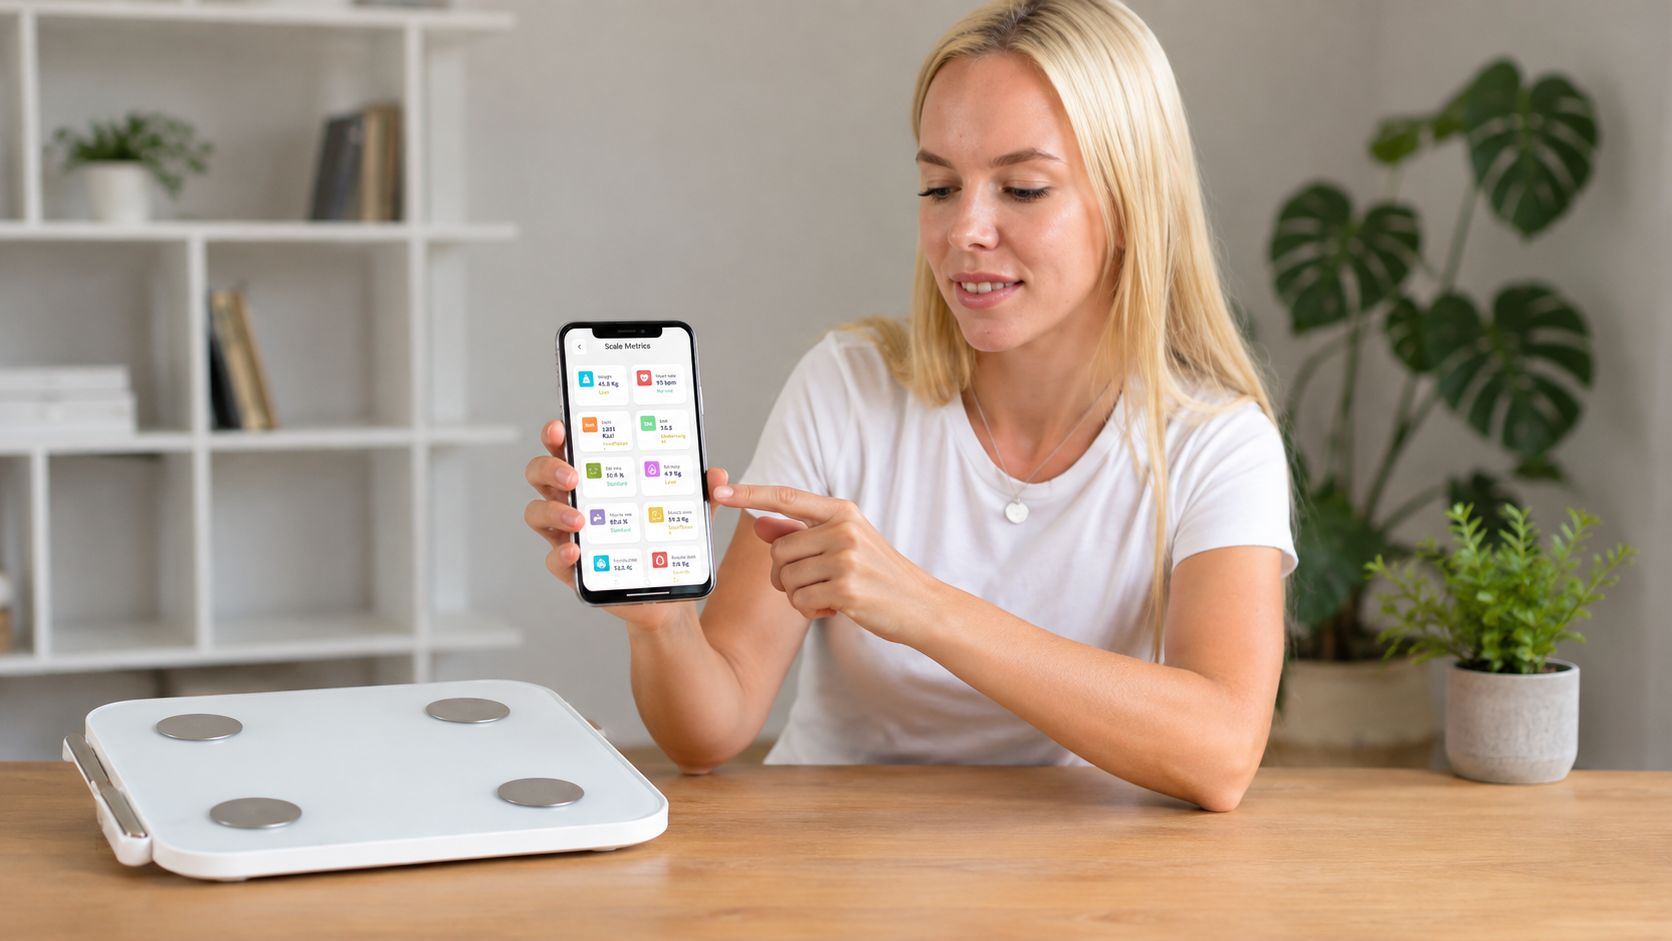
For home use, the most important control is consistency. Use the same device, at a similar time, under similar conditions and on the same type of surface. The Venus AI Smart Scale Body Composition & Body Fat Scale is one home-based option listed with weekly tracking, a six-page wellness report, trend charts, nutrition tracking and app-connected body-composition data. Treat its readings as estimates and focus on the direction over time, rather than comparing them with a different technology.
Why the Number Alone Can Mislead You
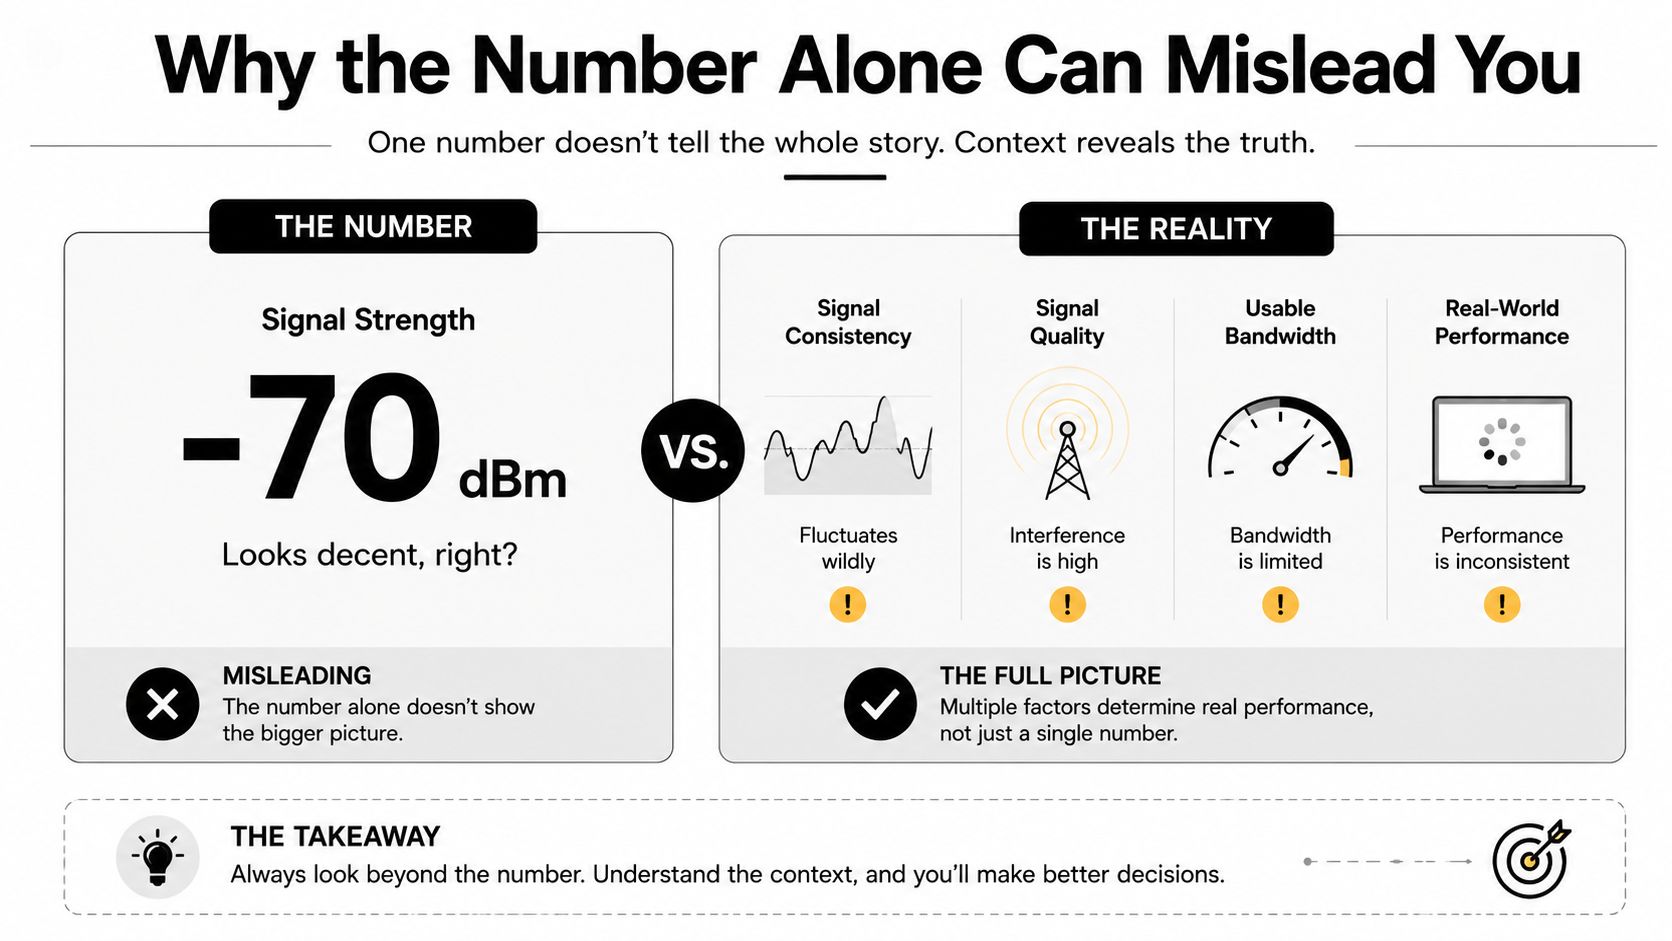
A single reading is a snapshot, not a verdict. The scale can't tell whether a change came from actual tissue adaptation, altered hydration, recent training, food intake or the conditions under which you measured.
That matters because body weight can stay stable while your composition improves. For example, a woman may lose some fat while maintaining or building muscle, leaving the bathroom scale relatively unchanged. The outcome can still include better strength, clothing fit, energy and physical capacity.
The reverse is also possible. A lower scale weight doesn't automatically mean better health if it reflects lost lean tissue, reduced training or inadequate nutrition. Muscle percentage can also rise because fat mass fell, even if absolute muscle mass stayed much the same. The percentage describes the relationship between compartments, not the whole story.
Hormones add useful context
Menstrual-cycle phase may affect how you feel, train and interpret a reading. Perimenopause can bring more variable sleep and recovery, while menopause changes the context in which fat and muscle trends should be read. Australian research shows that skeletal muscle declines across adulthood, so a trend needs to be interpreted with age rather than treated as a timeless score.
Pair the number with measures that reflect how your body works:
- Strength markers: Can you lift, squat, push or carry more confidently?
- Daily function: Do stairs, shopping and household tasks feel easier?
- Clothing fit: Are waistbands or sleeves changing even when weight isn't?
- Recovery: Are sleep, energy and soreness improving or worsening?
- Clinical context: If you're older or concerned about low muscle, ask a qualified clinician about appendicular lean mass and skeletal muscle index.
A lower percentage isn't automatically a failure, and a higher percentage isn't automatically proof of progress. The pattern becomes meaningful when you connect it with performance and function.
A Simple Weekly Routine to Track Real Progress
A weekly ritual works because it reduces noise without asking you to think about body composition every day. Choose one morning that fits your household, then repeat the same process as closely as possible.
Build the ritual
- Weigh in once weekly. Do it after waking and using the bathroom, before eating or drinking. If possible, choose the morning after a rest day.
- Run the composition scan. Use the same device and the same location. Bare feet, a stable surface and a repeatable routine make home readings easier to compare.
- Record the surrounding details. Note sleep, stress, recent training, unusual meals and menstrual-cycle day if applicable.
- Add three non-scale checks. Take a waist or hip measurement, write how your clothes feel, and record a simple strength marker such as push-ups or a repeatable squat variation.
- Review the trend. Look at several weeks together. One unexpected result is a prompt to observe, not a reason to change your entire plan.
You can keep the log in a spreadsheet, notes app or health platform. The tool matters less than whether you can see the sequence of readings and recognise when a change persists.
For guidance on measuring progress beyond body weight, use this muscle-gain measurement guide. If cycle changes are part of your notes, the Venus Smart Basal Thermometer for Ovulation, Bluetooth BBT Tracker with App records basal body temperature each morning and syncs readings to a phone through Bluetooth, according to its product information.
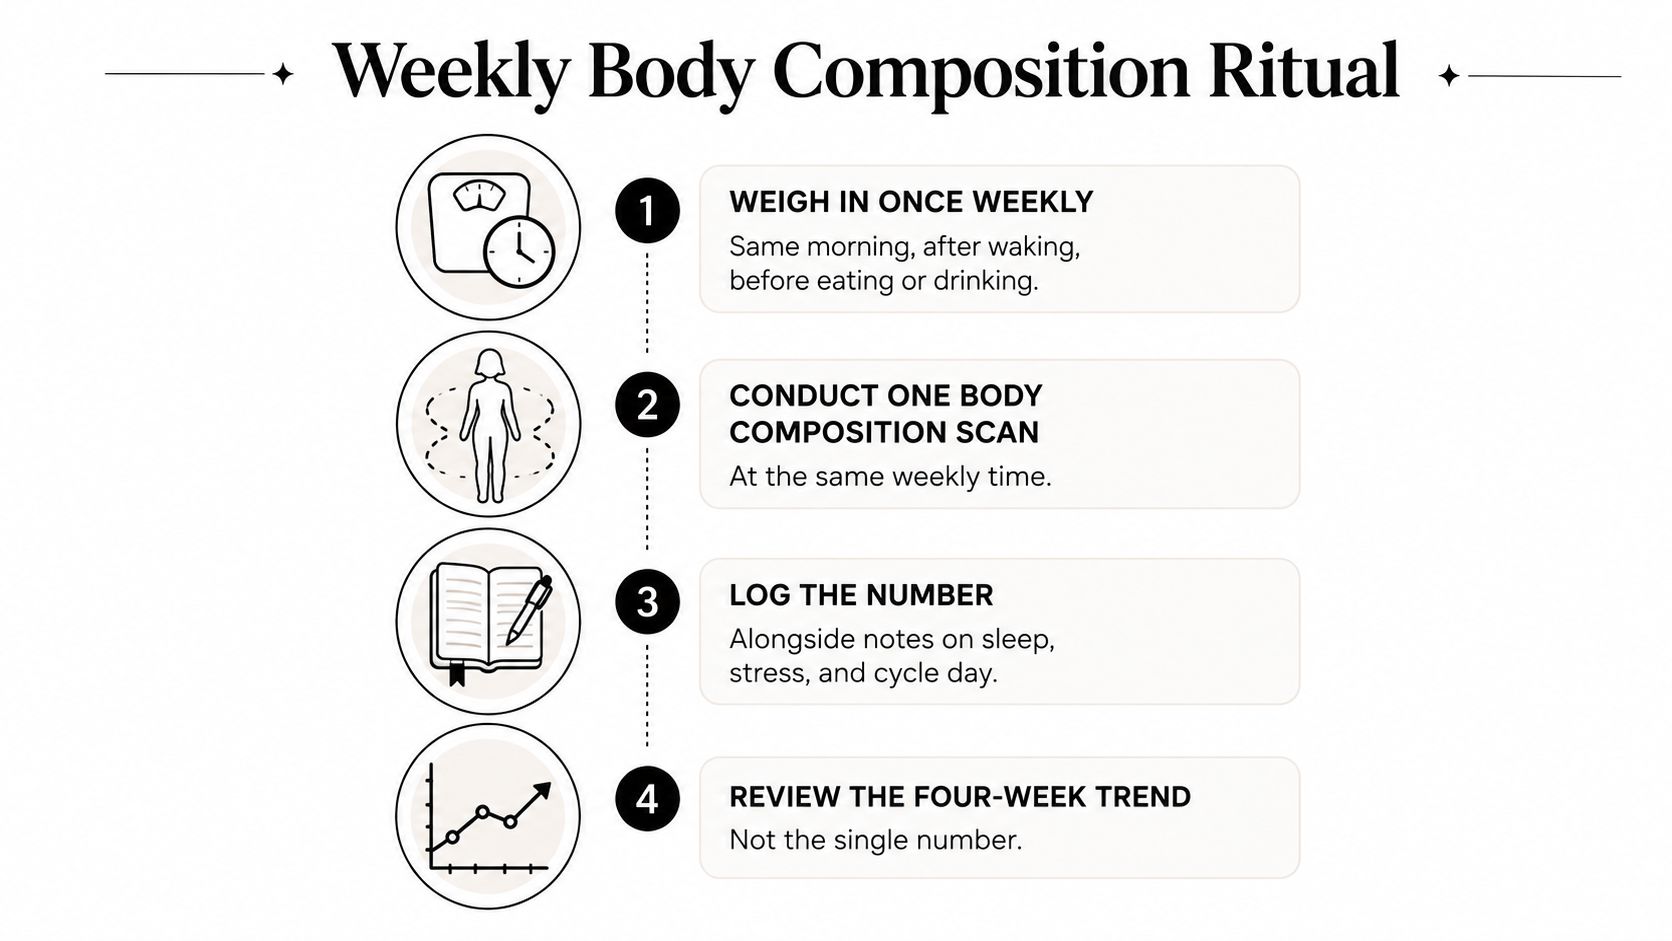
A consistent weekly check-in also gives busy women room for real life. A disrupted week, poor sleep or a missed workout becomes context in the record, not evidence that the plan has failed.
The Two Levers That Actually Move Muscle Percentage
If improving muscle percentage is the priority, put most of your limited effort into resistance training and adequate protein. Sleep, stress management, hydration and hormonal health support the process, but they don't replace a repeated muscle-loading stimulus or enough dietary building material.
Resistance training tells your body that muscle is needed. Start with movements that cover the major patterns, such as a squat, hinge, push, pull and carry. Progress can mean adding load, completing more controlled repetitions, improving range of motion or making the same exercise feel more stable. Two short sessions that you can repeat are more useful than an ambitious plan that disappears when work and family demands rise.
Protein supports repair and adaptation. Spread protein-containing foods across the day rather than leaving almost all of it for dinner. Meat, fish, eggs, dairy, tofu, legumes and other protein-rich foods can fit different dietary preferences. If you're unsure whether your intake is adequate, the discussion of the under-eating protein mistake may help you identify where meals are falling short.
| Goal | Strength Sessions per Week | Daily Protein Target | Per-Meal Protein Range |
|---|---|---|---|
| Preserve current muscle | Regular resistance work that fits your routine | Adequate intake for your body and health needs | Spread across main meals |
| Build gradually | Progressive sessions covering major muscle groups | Consistent daily protein intake | Include a meaningful protein source at each meal |
| Recompose while losing fat | Prioritise lifting over adding endless cardio | Avoid aggressive restriction that undermines training | Plan protein before convenience foods |
| Support later-life function | Keep resistance work regular and manageable | Discuss individual needs with a qualified professional | Distribute intake across the day |
Why cardio and dieting aren't enough alone
Cardio supports cardiovascular fitness and can be part of a healthy routine. It doesn't provide the same progressive loading signal as resistance exercise. Likewise, restrictive dieting may reduce body weight without protecting lean tissue, especially when training and protein intake fall at the same time.
Australian public-health data show the behaviour gap clearly. The Australian Institute of Health and Welfare reported that men were 1.2 times as likely as women to meet the muscle-strengthening activity guideline, based on AusPlay data. That matters because women don't need more pressure to shrink. They need practical opportunities to load and maintain muscle.
Australian Bureau of Statistics data also show 65.8% of Australian adults were overweight or obese in 2022, creating a mixed reality for many women: excess fat can coexist with insufficient muscle. That's why muscle percentage, strength and lean-mass trends can offer more useful information than BMI alone.
Your First Week of Tracking and What to Expect
Treat the first week as calibration, not an exam. You're learning how your device behaves, how your schedule affects training and which notes help explain your readings.
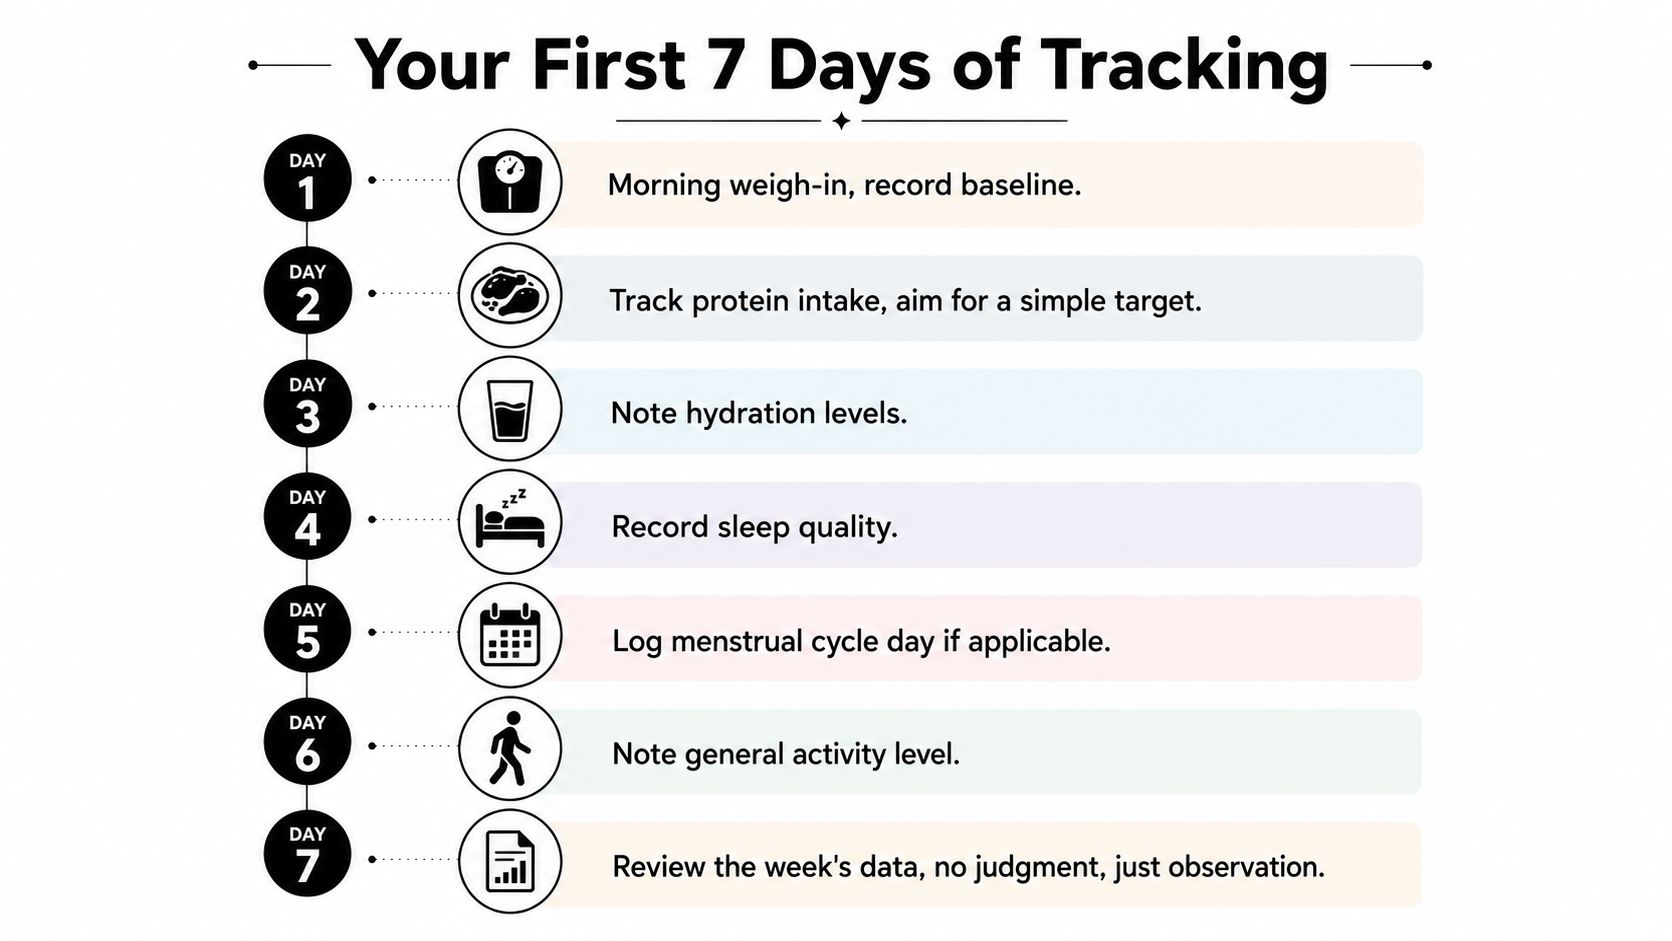
- Day 1: Weigh in under consistent morning conditions and record your baseline.
- Day 2: Note your protein intake without trying to overhaul every meal.
- Day 3: Record hydration and complete a short strength session if scheduled.
- Day 4: Write down sleep quality and general energy.
- Day 5: Log menstrual-cycle day if applicable, along with appetite or recovery notes.
- Day 6: Complete your second brief strength session or note your general activity.
- Day 7: Repeat the morning measurement and review the week without judgement.
Don't expect a meaningful muscle change from one week of readings. Small movements in a home estimate may reflect measurement conditions rather than new tissue, so use the first week to establish a repeatable baseline.
The better early result is a routine you can repeat. Once your notes, training and readings sit together, you'll have a clearer basis for decisions about food, strength work and recovery.
Venus Health Co. offers app-connected tools for tracking body weight, body fat, muscle data and weekly trends at home, including AI-generated summaries and nutrition tracking through its smart scale platform. If you want a more organised way to connect weekly composition readings with your routine, visit Venus Health Co. and explore the available health-tracking options.