

How Does a Smart Scale Measure Muscle Mass
Dr. Adeyinka AdegbosinYou step onto your smart scale after weeks of strength training. Your lifts are improving, your clothes fit differently, yet the muscle-mass figure on your phone barely moves. How does a smart scale measure muscle mass if it never directly sees your muscles?
The answer is less mysterious, but also less exact, than many app screens suggest. A smart scale uses electrical signals, your body's resistance to those signals, personal profile details, and mathematical equations to produce an estimate. That estimate can help you follow direction over time, but it isn't a direct measurement like body weight.
For Australian users, interpretation also depends on context. Hydration, recent exercise, food intake, age, sex, body structure, and the population data behind the algorithm can all influence the result. Understanding that process helps you decide when a change may represent genuine progress and when it's more likely measurement noise.
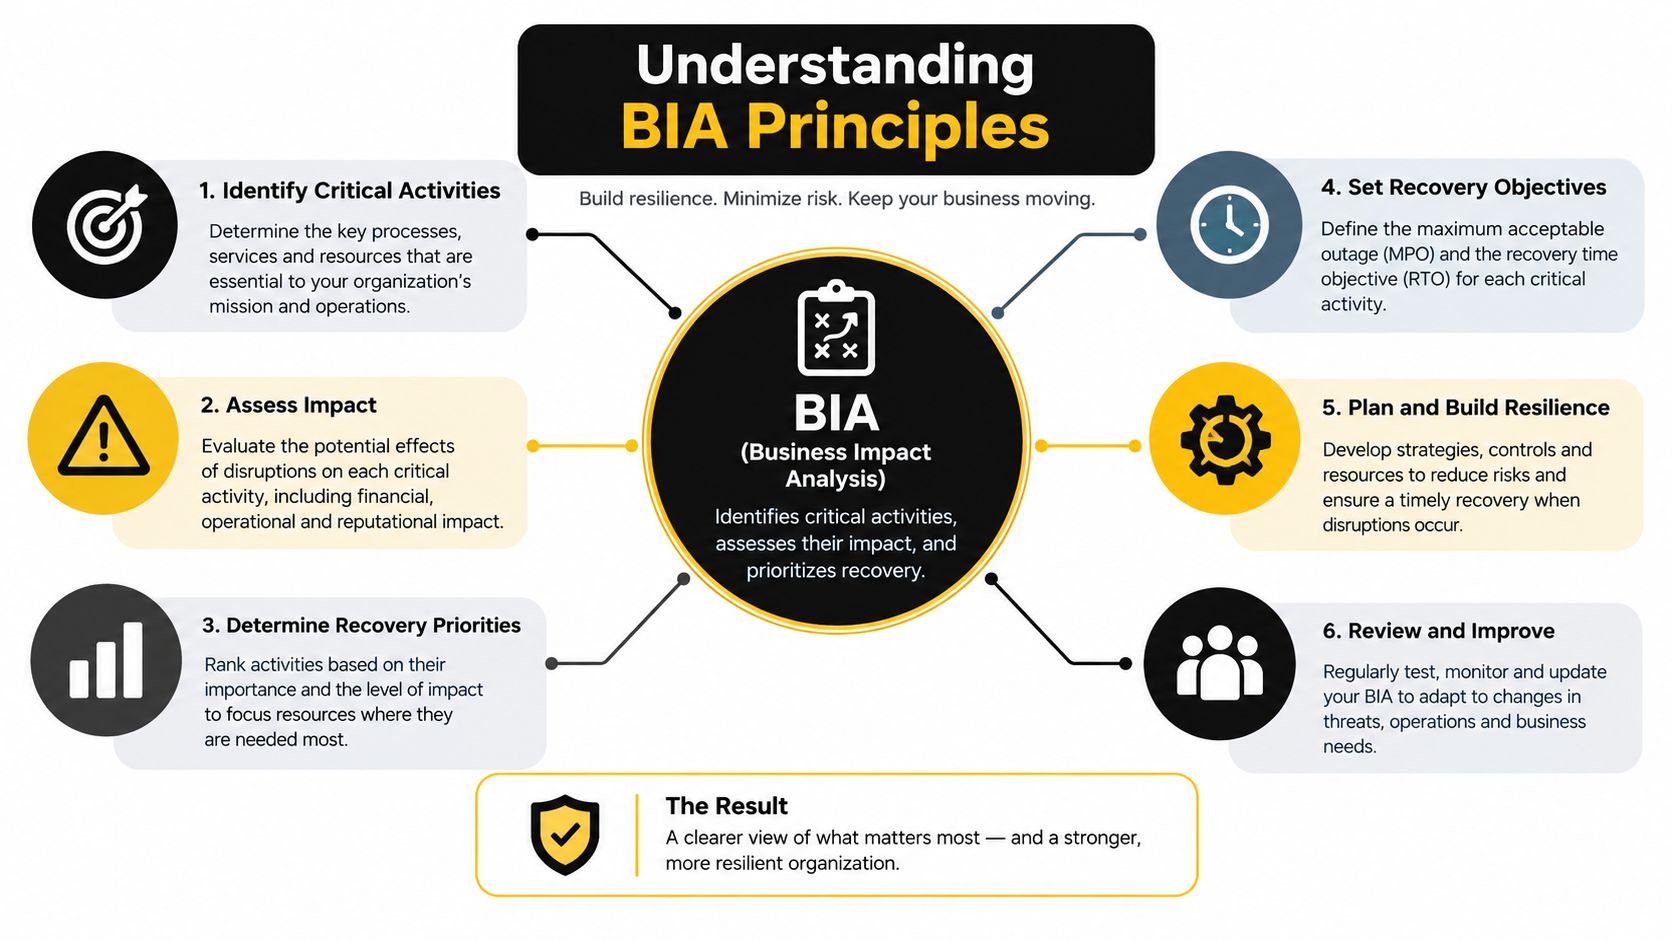
Understanding BIA Principles
A smart scale does not see muscle directly. It estimates muscle mass with bioelectrical impedance analysis, or BIA, by sending a safe, low-level electrical current through the body and measuring how strongly the body resists it. Australian product documentation describes BIA as the standard approach used by body-composition smart scales, which may also estimate body water, bone mass, fat mass, and other metrics in one reading (Australian smart-scale product information).
The electrical signal moves more easily through water-rich, lean tissue than through fat. A useful comparison is a road network: a clear, wide route allows traffic to pass, while a restricted route slows it down. Muscle generally contains more water than fat, so the signal's measured resistance can provide clues about the amount of lean tissue in its path. The scale converts those clues into an estimate of muscle mass.
What happens during a weigh-in
The calculation usually follows this sequence:
- You stand barefoot on the electrodes. Metal contact points send and receive the low-level signal.
- The signal passes through different tissues. Water-rich tissue conducts it differently from fat and bone.
- The scale records impedance. This includes the resistance and reactance detected by the device.
- The software combines inputs. Weight, height, age, sex, and impedance enter the calculation.
- The app displays an estimate. Depending on the model, the label may be muscle mass, skeletal muscle mass, or lean mass.
The final number is not muscle removed from your body and weighed separately. It is an algorithmic estimate based partly on the water and lean tissue the signal appears to encounter. A hydration change can therefore shift the result even when your actual muscle tissue has not changed. A reading after exercise, a meal, or substantial fluid intake may not be directly comparable with a reading taken under different conditions.
Australian reference data adds another interpretive layer. The 1999–2000 Australian Diabetes, Obesity and Lifestyle study, known as AusDiab, analysed 8,582 Australian adults aged 25–91 and used BIA-derived estimates to establish reference ranges for fat-free mass and skeletal muscle mass (AusDiab-related Australian product reference). The study found that fat-free mass, skeletal muscle mass, and skeletal muscle mass index generally declined linearly from age 25 onward.
Those reference equations matter because the device interprets impedance alongside characteristics such as age and sex. The result reflects both your electrical response and the assumptions built into the reference population. An Australian user may therefore receive an estimate shaped by equations developed from Australian population data, while another device may apply a different reference set.
A device such as the Venus AI Smart Scale: Body Composition & Body Fat Scale presents body-composition metrics and historical trends for home monitoring. Treating the trend as context, rather than treating one result as a direct clinical measurement, gives the number a more realistic meaning.
Role of Electrodes and Impedance Measurement
How can a scale estimate muscle through your feet? Electrodes provide the contact points. In a basic foot-to-foot model, they send a small electrical signal up one leg, across the body, and down the other. The scale measures how the signal returns and calculates impedance, the resistance encountered along that route.
The route limits the information available. A current travelling mainly through the legs and lower trunk says less directly about the arms and upper body. Scales with hand grips add pathways through the arms, trunk, and legs. Segmental BIA examines these separate routes to estimate how lean tissue is distributed between body regions.
Why contact and positioning affect results
Your feet must contact the electrode areas consistently. Socks interrupt the pathway. Wet skin or unusually dry skin can change contact and signal transmission, while a different stance can alter the current's route. These small changes can make a result look like a body-composition change when it partly reflects measurement conditions.
Modern Australian-market devices increasingly use multi-frequency BIA. Some models apply frequencies such as 20 kHz and 100 kHz across body segments. Other Australian product documentation describes multi-frequency measurement as a method for refining outputs that include muscle mass (Australian multi-frequency scale documentation).
The reason relates to body water. Lower and higher frequencies interact differently with fluid compartments. Comparing those responses gives the algorithm more information about extracellular and intracellular water, which helps it interpret the tissue environment associated with skeletal muscle. Hydration shifts can therefore affect the estimate, even when your actual muscle has not changed.
Practical rule: Place the scale on a hard, level surface and use the same foot position each time. Consistent conditions make the trend more useful, although they cannot turn an estimate into a direct muscle measurement.
The Venus Smart Basal Thermometer for Ovulation - Bluetooth BBT Tracker with App uses a different method, basal body temperature rather than BIA. Keeping the two technologies separate prevents confusion about which signal each device measures.
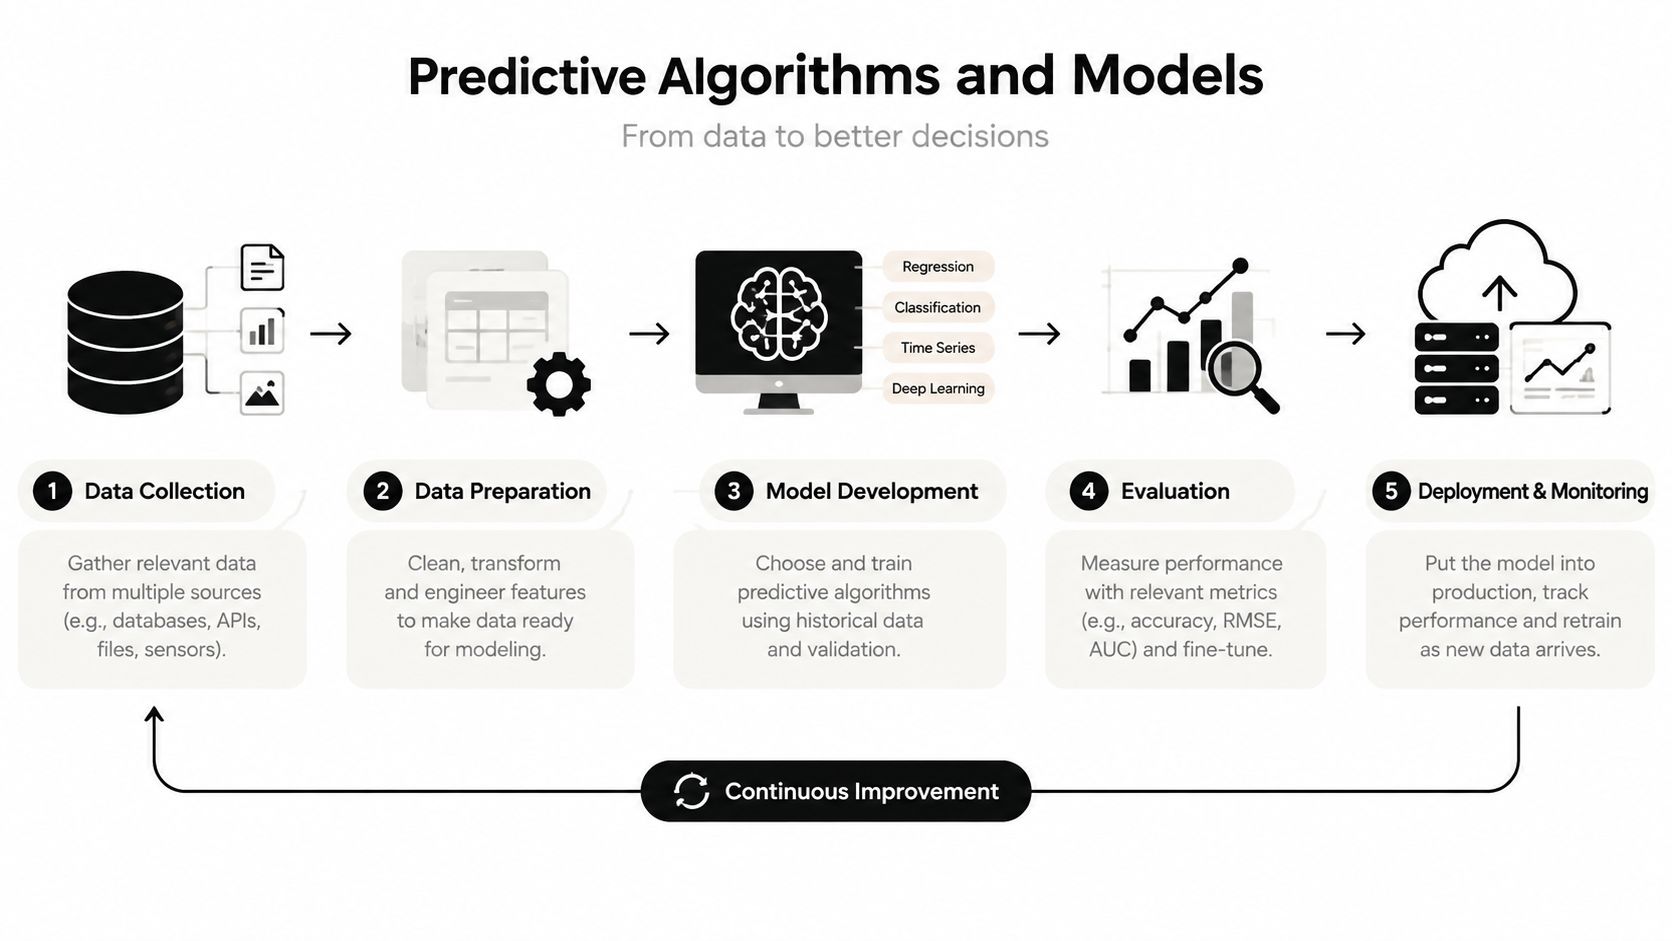
Predictive Algorithms and Models
Raw impedance is a signal, not a muscle measurement. The scale combines it with body weight and profile details, then applies an equation to estimate body composition.
A simplified process works like this:
- The scale captures weight and impedance.
- The app supplies profile information, such as height, age, and sex.
- The algorithm combines the variables using an equation developed from reference data.
- The software estimates body compartments, including fat-free mass and skeletal muscle mass.
- The app stores later readings so you can compare results over time.
The calculation answers a probability question: given this person's impedance, body size, and profile, which body-composition result best fits the model? It does not directly weigh the person's muscle tissue. That distinction explains why a hydration change can alter the estimate even when actual muscle has stayed the same.
Why algorithms differ between scales
Two devices can report different muscle-mass results for the same person. They may use different electrode layouts, frequencies, segmental pathways, equations, or reference populations. A result from one brand should therefore be compared with that device's own future readings, rather than treated as interchangeable with another brand's result.
Australian-market devices may use dual-frequency BIA, with 20 kHz and 100 kHz examples, to compare how electrical signals respond at different frequencies. That comparison gives the model more information about fluid compartments and can support estimates such as skeletal muscle mass. Because hydration affects those compartments, the result remains an estimate rather than a direct tissue reading.
Machine-learning wording can also sound more individualised than the process really is. An app may recognise your usual pattern and present clearer summaries, while the underlying estimate still depends on the measured signal and the model's assumptions. Personalised displays can make trends easier to read, but they do not remove biological variation.
Use the result directionally. Readings collected under similar conditions that gradually move together may support changes seen in training performance, measurements, photos, or clothing fit. One unexpected result cannot establish that muscle has suddenly appeared or disappeared.
Real-World Examples of Muscle Mass Tracking
Alex weighs in on Monday mornings using the same routine. The reading follows a broadly steady upward pattern during a resistance-training block, and gym performance is improving too. Alex treats the scale as one piece of evidence, not as proof that every small change represents new contractile muscle.
Priya's chart looks far more erratic. She sometimes measures after a late workout, sometimes after drinking more water than usual, and sometimes at a different time of day. Australian-facing guidance notes that post-workout hydration and body type can influence BIA results, but that nuance is often missing from consumer explanations (Australian guidance on bathroom-scale interpretation).
Reading the pattern instead of reacting to the spike
Alex's useful signal comes from repetition. Priya's immediate task is to standardise the conditions before deciding whether the underlying trend has changed.
For both users, a practical log should include:
- Measurement conditions: time, hydration, recent training, and meals.
- Performance markers: repetitions, load, endurance, or recovery.
- Physical indicators: clothing fit, progress photos, and circumference measurements.
- Nutrition context: whether eating patterns support training and recovery.
Readers working on strength and body-composition goals may also benefit from these core and nutrition tips for women, particularly when scale data is being interpreted alongside training and dietary habits. For a focused explanation of using repeated readings to assess progress, see this guide to measuring muscle gain.
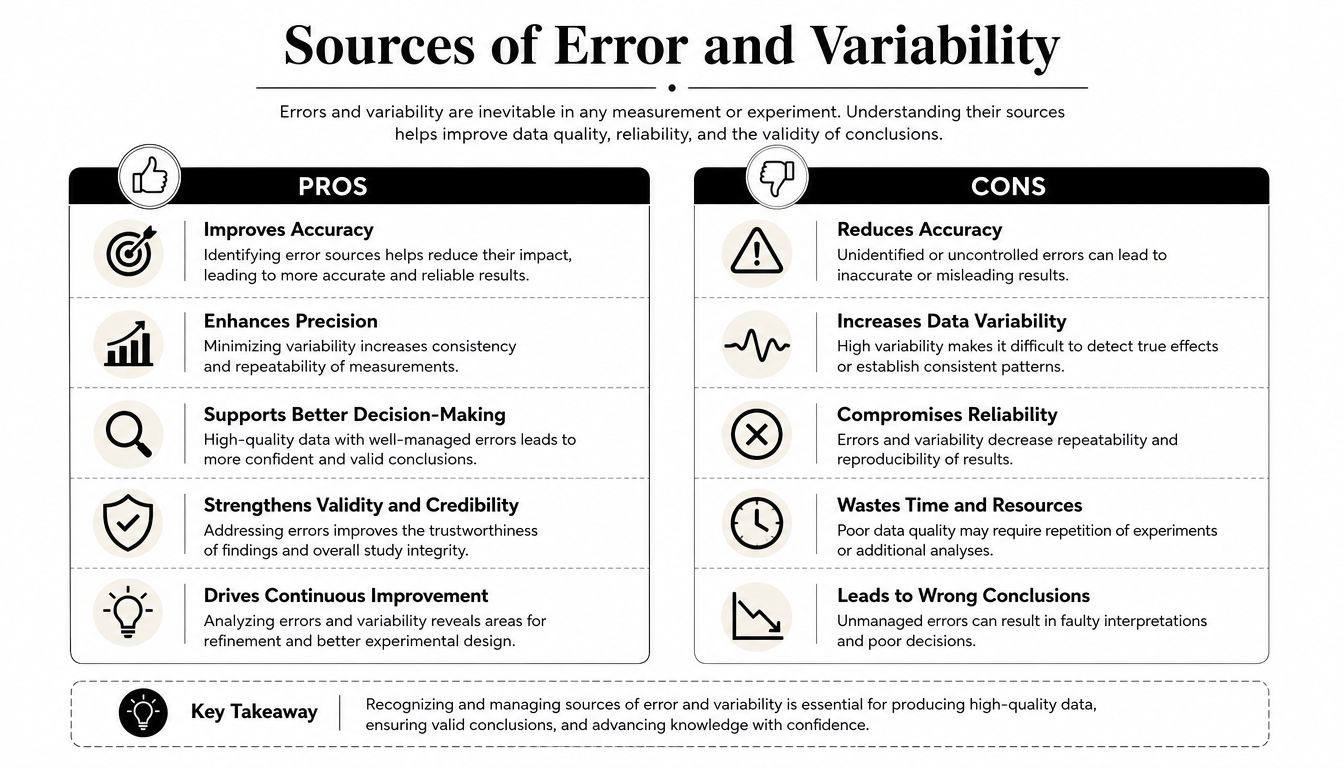
Sources of Error and Variability
A muscle-mass reading that changes on your app may reflect your body, your measurement conditions, or both. BIA responds to water distribution, so hydration changes can alter impedance without representing a genuine change in muscle tissue.
Recent exercise can shift fluid between compartments and change circulation. Food and drink add body mass and affect the timing of the reading. Temperature, skin contact, foot placement, and the surface beneath the scale can also influence repeatability.
The precision-display trap
A screen may show a muscle-mass value with a decimal place, but that formatting doesn't guarantee equivalent biological precision. The number looks exact because the software calculates a specific output. The estimate itself remains sensitive to the conditions under which the impedance was recorded.
A peer-reviewed study found that smart scales were accurate for total body weight but that their body-composition estimates could vary with hydration, exercise timing, and extreme body types (peer-reviewed smart-scale accuracy study). The study's practical implication is clear: a device may be useful for tracking weight and observing direction while still misestimating absolute muscle mass for some users.
A repeatable routine reduces noise. It doesn't remove the limits of the method.
Severe obesity and other body-composition extremes deserve particular caution because the equations may not represent every body structure equally well. If your readings seem implausible, conflict sharply with other evidence, or are being used for medical decisions, discuss an appropriate assessment method with a qualified health professional. You can also compare common claims about consumer-device performance with this explanation of smart-scale accuracy.
Accuracy Compared to Clinical Methods
Home BIA and clinical methods answer related but different questions. A smart scale is built for repeated convenience. Clinical methods are used when a more controlled and detailed assessment is needed.
DXA, or dual-energy X-ray absorptiometry, assesses body composition using low-dose X-ray measurements. Hydrostatic weighing estimates body density through underwater weighing. Both require a controlled setting and trained operation, while a smart scale can be used at home with very little effort.
| Method | Accuracy | Typical Use Case |
|---|---|---|
| Smart scale using BIA | Provides an estimate that can be affected by hydration, exercise timing, body structure, electrode contact, and the model's reference equations | Convenient home tracking of weight and body-composition direction |
| DXA | More controlled and detailed than consumer BIA for body-composition assessment, though results still depend on the testing process | Clinical, research, medical, or structured fitness assessment |
| Hydrostatic weighing | Uses body-density calculations in a controlled underwater setting rather than household impedance readings | Specialist assessment and research-oriented comparison |
The comparison doesn't make smart scales useless. It clarifies their role. If you want to know whether your readings are moving broadly alongside a training or nutrition plan, regular home measurements can be practical. If you need a precise baseline, are investigating a health concern, or are making a significant medical decision, a clinical method is more appropriate.
Why the same person can receive different results
A BIA scale and a DXA scanner don't measure your body through the same physical process. They also may classify body compartments differently and use different assumptions. Therefore, a difference between readings isn't automatically evidence that one device has malfunctioned.
For a deeper look at what a DXA assessment can and can't tell you, read this guide to a DEXA scan and body fat. Use clinical testing when the decision requires greater measurement control, and use home BIA when the priority is a sustainable routine.
Tips to Improve Consistency and Interpret Your Muscle Mass Results
The most useful smart-scale routine is boring by design. Measure under conditions you can repeat, then judge the pattern rather than the most dramatic daily movement.
Build a repeatable protocol
Use this checklist:
- Choose a consistent time: Many people find morning measurements easier to standardise, before changing routines, meals, or exercise.
- Keep hydration comparable: Don't compare a well-hydrated reading with one taken after heavy sweating or unusually high fluid intake.
- Avoid immediate confounders: Leave a consistent gap after exercise and large meals rather than measuring directly afterwards.
- Use a firm surface: Place the scale on a hard, level floor, not a soft or uneven surface.
- Maintain contact: Step on barefoot, with both feet positioned similarly each time.
- Record context: Note late training, unusual meals, illness, travel, or other factors that may explain a sudden change.
Choose one schedule you'll maintain. Daily readings can provide more observations, while weekly measurements can feel simpler and less intrusive. Either approach can work if you keep the conditions stable and focus on the longer pattern.
For broader ideas on combining scale readings with performance, habits, and other indicators, explore Pretty Progress's fitness tracking tips. A separate product such as the Venus Ovulation Predictor Test Kit measures a different physiological signal, so it shouldn't be confused with a tool for estimating muscle mass.
The central rule is simple: treat the muscle figure as trend data, not a gold-standard value. Compare it with strength progression, recovery, nutrition, body measurements, and how you feel. If the number changes sharply after a hard session or unusual hydration pattern, record the context before changing your training plan.
If you want one place to organise home body-composition readings and related health trends, visit Venus Health Co. to explore its app-connected tools. Use the data to build a consistent measurement habit, then interpret the trend with the same care you bring to your training and nutrition decisions.