

Body Composition Scale Accuracy: Best Buying Guide
Dr. Adeyinka AdegbosinMost advice about body composition scales starts with the wrong question. People ask, “Is this smart scale accurate?” as though accuracy were a single switch that's either on or off. The more useful question is: Is this scale consistent enough to help me understand change over time, and how far should I trust the number it displays?
That distinction matters for Australian home users. A bathroom scale can produce remarkably repeatable readings while still estimating your body fat percentage incorrectly for your individual body. The practical answer isn't to throw the scale away. It's to understand what it measures, control the conditions around each reading, and treat the result as a trend tool rather than a clinical instrument.
What a Body Composition Scale Actually Measures
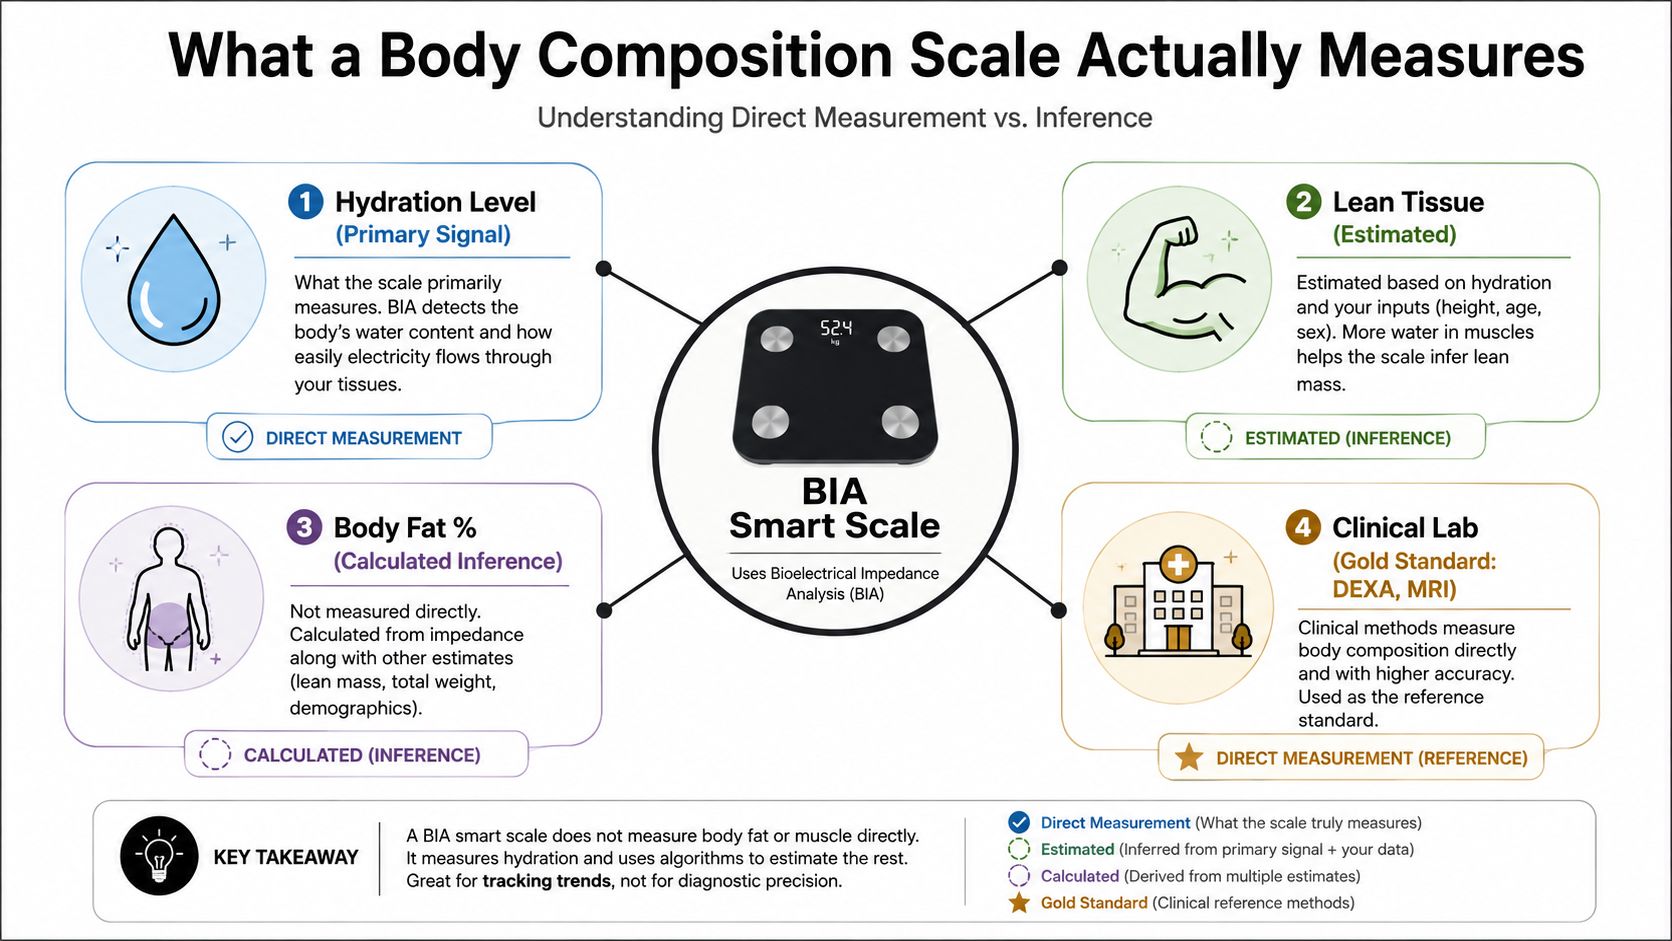
Many people step on a smart scale expecting it to measure fat directly. It doesn't. A home body composition scale usually uses bioelectrical impedance analysis, or BIA, to send a small electrical current through the body via electrodes under the feet. The device measures how the current moves through your body, then uses that signal, along with details such as height, age and sex, to estimate body composition.
The electrical signal meets different levels of resistance, or impedance, in different tissues. Water-rich lean tissue generally conducts electricity more readily than fat tissue. The scale records impedance, not fat mass. Its software then converts that impedance into an estimated body fat percentage through an equation, often one the manufacturer doesn't fully disclose.
That means the displayed percentage is an inference, not a direct observation of your tissues. The equation has been developed for a particular population and measurement design, so its result can be less suitable for someone whose body, hydration state or proportions differ from the group used to develop it.
The signal is useful, but indirect
Think of BIA like estimating the contents of a sealed parcel by measuring how easily a signal passes through it. You can collect a repeatable signal, but you haven't opened the parcel and weighed every item inside. A foot-to-foot scale also sends current through a limited route, which means the estimate depends on assumptions about how your body is proportioned.
This is why extra app metrics can look more precise than the underlying measurement deserves. Muscle mass, body water, visceral fat and metabolic age may appear as separate figures, but they're still derived from the same basic signal and algorithm. More displayed fields don't automatically mean more direct measurements.
A helpful introduction to the broader topic is Trim variant-a, which places body composition analysis in context rather than treating one household reading as a complete assessment. You can also review what body composition means before deciding which metrics are relevant to your goal.
The starting point is simple:
A BIA scale measures impedance and estimates body composition. It doesn't directly weigh your fat or muscle.
That doesn't make it useless. It changes the standard you should apply. The strongest use case is repeated measurement under similar conditions, where the direction of the readings may help you monitor progress. The weakest use case is comparing one home percentage with a laboratory result and assuming they should match.
The Factors That Move Your Reading Day to Day
A BIA reading can change because the electrical path through your body changes, even when your actual fat tissue hasn't. Hydration, timing and the scale's algorithm are the major influences, but they interact with ordinary life.
Take a 70 kg adult who drinks 500 ml of water before stepping on the scale. That drink changes total body water and body weight immediately. It hasn't created new fat, but it can alter impedance and the equation's interpretation enough to move the displayed body fat percentage by a noticeable amount, potentially a full percentage point or more. The exact shift depends on the person, device and algorithm, so the example demonstrates sensitivity rather than a guaranteed result.
Recent training can redistribute fluid between compartments. A salty meal, alcohol, glycogen changes, menstrual phase, food in the digestive tract and moisture on the feet can also affect contact or conductivity. These are best treated as noise sources, not automatic evidence that the device is broken.
| Variable | Direction of shift | Approximate effect on body fat % |
|---|---|---|
| Hydration status | May shift higher or lower | Device- and person-dependent |
| Recent food or fluid intake | May shift higher or lower | Device- and person-dependent |
| Exercise and fluid redistribution | May shift higher or lower | Device- and person-dependent |
| Alcohol or high-sodium intake | May shift higher or lower | Device- and person-dependent |
| Menstrual phase | May shift higher or lower | Device- and person-dependent |
| Damp or inconsistent foot contact | May shift higher or lower | Device- and person-dependent |
Why the algorithm matters
Two Bluetooth scales can receive a similar impedance signal and return different body fat estimates because their equations interpret it differently. Review-level evidence indicates that population-specific prediction equations can improve BIA performance, while built-in firmware algorithms shouldn't be accepted blindly. Comparative work across 15 BIA devices found that average differences could look small while validity still varied substantially by model, with constant error relative to a 4-compartment reference ranging from about -3.5% to 11.7% (review evidence and comparative findings).
That's why you shouldn't switch between brands halfway through a training block and interpret the new number as a real change. Use the same device, in the same way, and record context. A separate explanation of digital scale measurements can help you think about the reading as a measurement process rather than a verdict.
If your broader routine includes cycle tracking, the Venus Smart Basal Thermometer for Ovulation - Bluetooth BBT Tracker with App records basal body temperature each morning and syncs it to an app via Bluetooth. That data relates to a different physiological signal, so it shouldn't be treated as a correction for body composition readings.
Smart Scales Versus Gold-Standard Methods
Researchers judge a body composition device by comparing it with a criterion method, not by asking whether it tracks weight alone. An Australian University of Sydney project is comparing publicly available body composition scales with a 4-compartment model that combines DXA, air displacement plethysmography, deuterium dilution and MRI or spectroscopy. That design shows how demanding reference measurement can be (University of Sydney research project).
A DXA scan uses low-dose X-rays to estimate bone mineral, lean tissue and fat across the body. It can show regional distribution, such as differences between limbs and the trunk, while a typical bathroom scale reports one whole-body estimate. Hydrostatic weighing estimates body density through underwater weighing and depends partly on how much air remains in the lungs. A Bod Pod uses air displacement rather than water, but it still measures under controlled conditions that aren't available in a bathroom.
The 4-compartment model goes further by combining several measurements to account for body water, mineral and protein components. It's valuable for research comparisons, but it's not a practical routine tool for most households.
| Method | What it measures | Typical error margin | Cost for user | At-home practical? |
|---|---|---|---|---|
| Foot-to-foot BIA scale | Impedance, then estimated body composition | Varies by device and individual | Usually more accessible than laboratory testing | Yes |
| DXA | Regional bone, lean tissue and fat estimates | Varies by scanner and protocol | Paid clinical or research service | No |
| Hydrostatic weighing | Body density through underwater weighing | Affected by testing technique and residual lung air | Paid specialist service | No |
| Bod Pod | Body volume and density through air displacement | Affected by protocol and assumptions | Paid specialist service | No |
| 4-compartment model | Multiple body components using combined methods | Used as a strong reference, not a perfect truth | Research or specialist setting | No |
The data illustrate why a tidy app display shouldn't be confused with a laboratory measurement. In overweight and obese men, one BIA method correlated strongly with DXA for fat mass and fat-free mass, with r² = 0.81 for both, yet absolute agreement was poor. Its fat-mass bias was -6.6 ± 7.7 kg, and body-fat-percentage bias was -7.0 ± 6.6% (peer-reviewed comparison).
A consumer Tanita scale in the same paper had only modest body-fat-percentage correlation, r² = 0.44, with wide limits of agreement of 1.2 ± 9.5%. These figures don't mean every user will see the same error. They show why a scale may be useful for following direction without being suitable for a clinical decision.
For a plain-language discussion of how DXA fits into body composition assessment, see DXA scans and body fat. The sensible comparison isn't “Which number is the true one?” It's “Which method answers the question I'm asking?”
Why Precision Is Not the Same as Accuracy
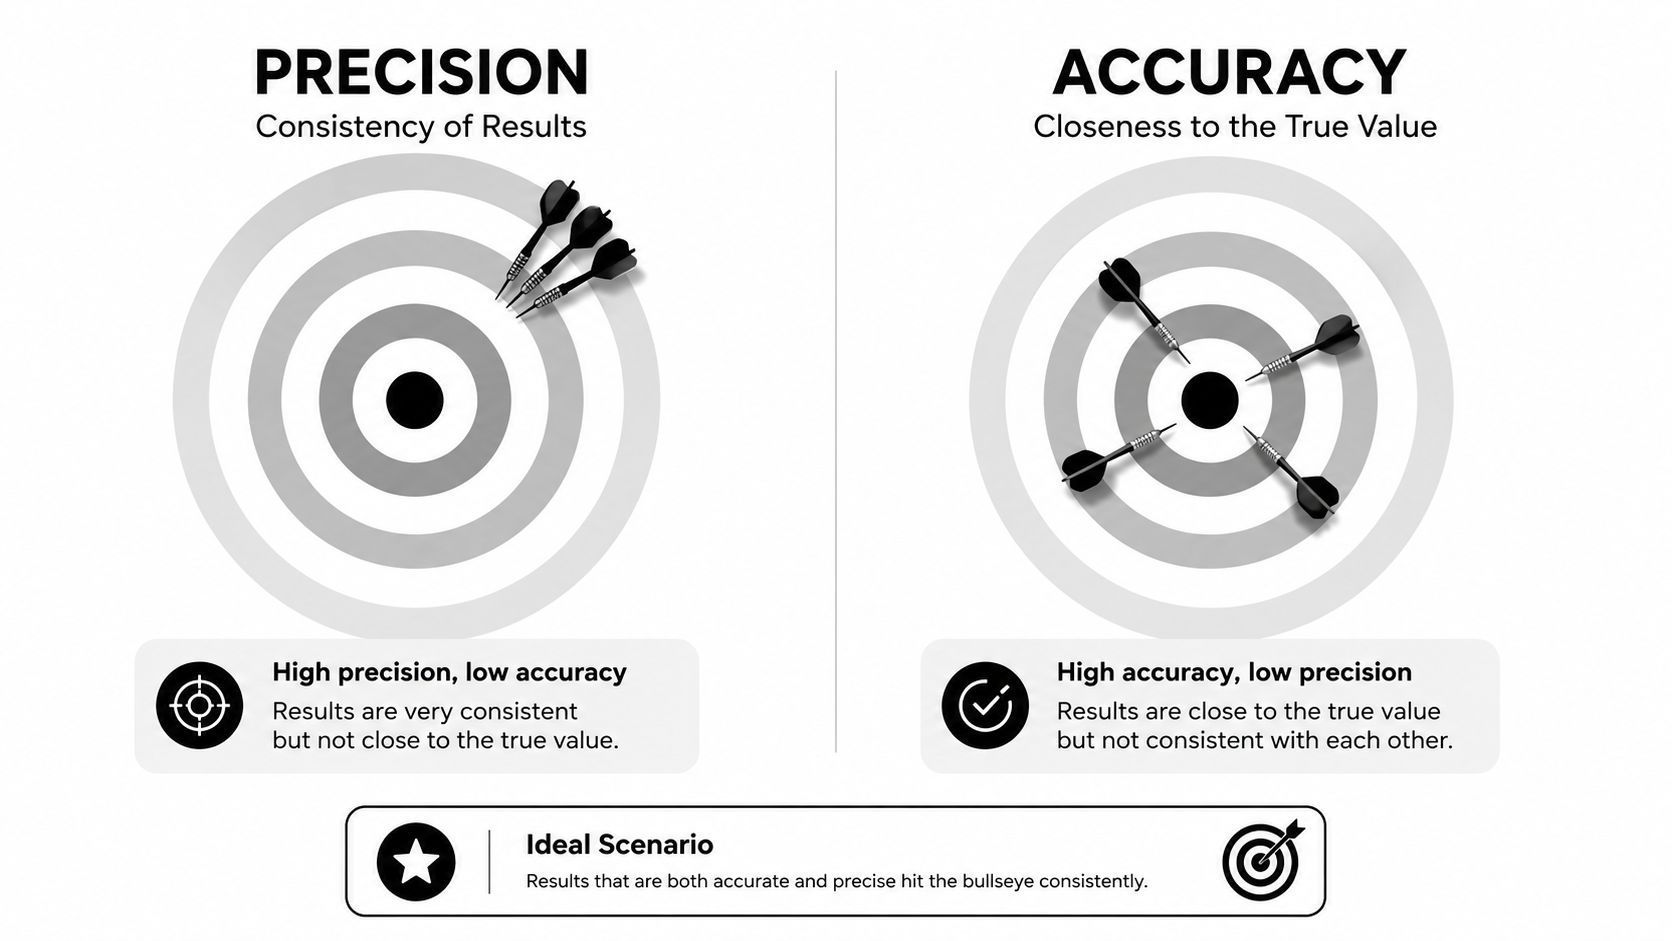
Precision means repeatability. Accuracy, often discussed as validity, means closeness to a suitable reference. A dartboard makes the difference obvious: darts clustered tightly in the wrong place are precise, but they aren't accurate.
The same pattern can appear on a bathroom scale. If you step on under nearly identical conditions and receive nearly identical readings, the device may be highly precise. Yet the algorithm could consistently place your body fat estimate above or below the value produced by a criterion method.
A Southern Cross University analysis found BIA precision error for body fat percentage, fat mass and fat-free mass was very low, ranging from 0.0% to 0.49%, showing that repeated readings can be highly consistent even when absolute accuracy varies by device and equation. In that analysis, BIA's body-fat-percentage precision error was 1.25%, compared with 1.17% for DXA, but the authors assessed validity separately because precision alone doesn't prove true accuracy (Southern Cross University analysis).
Why individual error matters
A population equation can perform acceptably on average while missing the mark for a particular person. Limb geometry, body shape, hydration distribution, age, sex and training status all influence the relationship between impedance and actual tissue compartments. The scale doesn't know your exact personal calibration unless the manufacturer's model happens to fit you closely.
Independent validation of foot-to-foot consumer BIA devices found body-fat estimates differed from 4-compartment reference values by -3.0 to 4.4 percentage points, while fat-free-mass estimates differed by -3.3 to 1.9 kg. The investigators concluded that these devices had poor individual accuracy, although they could still help with group or longitudinal tracking (independent validation study).
That's the contrarian point many buying guides miss: a stable number can be confidently wrong. Stability improves your ability to detect a shift in the device's own readings, but it doesn't guarantee that the displayed percentage is your laboratory value.
If you use another home test, apply the same logic. For example, the Venus Ovulation Predictor Test Kit is described in its product information as a home LH test with a stated 99% accuracy claim, but that claim concerns ovulation-test performance, not BIA or body composition scale accuracy. Different tools measure different signals, so accuracy claims can't be transferred from one category to another.
How to Take a More Reliable Reading at Home
You can't turn a bathroom BIA scale into a 4-compartment laboratory model. You can, however, reduce avoidable variation by giving the device a similar physiological starting point each time.
Measure at a consistent time, preferably after waking, using the bathroom and before breakfast or fluids. Keep the scale on a hard, flat floor rather than a soft or uneven surface. Clean, dry feet and consistent foot placement help the electrodes make comparable contact.
Use a repeatable protocol
Use this as a control checklist, not a ritual you must follow perfectly:
- Choose one measurement window. Morning readings are easier to standardise than readings taken after a full day of meals, fluids and activity.
- Empty your bladder first. This removes one ordinary source of variation in body weight and timing.
- Keep intake consistent. Avoid measuring immediately after food, alcohol, caffeine or a large drink.
- Separate measurement from training. Exercise can shift fluid between body compartments and change skin conditions, so wait until your usual resting state.
- Match the environment. Keep the scale in the same place and avoid moving it between soft and hard flooring.
- Stand the same way. Use the same foot position, remain still and make full, dry contact with the electrode plates.
Practical rule: Control the state of your body, not just the buttons on the app.
The reason is physical. BIA is strongly influenced by body water and short-term fluid redistribution. Matching those conditions makes successive readings more comparable, but it doesn't improve the underlying equation's ability to identify your true fat mass.
This video can reinforce the practical measurement routine:
If you miss a morning or measure after a workout, keep the result rather than deleting it without a note. Mark the unusual condition. Context helps you decide whether a sudden change deserves attention or belongs in the noise category.
Reading Your Weekly Trend Without Overreacting
Daily body fat percentages invite overreaction because the app presents each reading as a fresh answer. Your body hasn't necessarily changed in the way the number suggests. A single result reflects weight, water, tissue conductivity, contact and the algorithm's assumptions at that moment.
Use a 7-to-14-day window to judge direction. A daily reading is raw data. A weekly or fortnightly average is closer to a decision signal because isolated spikes have less influence.
Consider a worked example. The table below uses an illustrative pattern, not a measured case study, to show how a reader might interpret a gradual drift from 22.1% to 21.0% while individual readings vary by ±0.6%.
| Day | Reported body fat % | Condition at weighing | Trend vs prior week |
|---|---|---|---|
| 1 | 22.1% | Standard morning reading | Starting point |
| 4 | 22.7% | Higher-sodium dinner the night before | No conclusion |
| 7 | 21.9% | Standard morning reading | Early average broadly stable |
| 10 | 21.5% | After a harder training day | Possible short-term noise |
| 14 | 21.8% | Standard morning reading | Direction beginning to soften |
| 21 | 21.3% | Standard morning reading | Lower than the earlier average |
| 30 | 21.0% | Standard morning reading | Lower monthly trend |
What to record beside the number
A note beside the reading often explains more than another decimal place. Record whether you trained late, slept poorly, ate a saltier meal, drank alcohol, felt unusually dehydrated or were at a different menstrual phase. Those notes don't prove why a reading moved, but they help you identify repeated patterns.
Look at the line, not the loudest point. If the app shows one high reading followed by a return to the previous range, don't label it fat gain. If the rolling average keeps moving in one direction under broadly similar conditions, that pattern deserves more weight.
Decision signal: React to a confirmed change in the average, not to one dramatic morning.
Weight and body fat percentage also answer different questions. Weight reflects total mass, while body fat percentage is an algorithmic estimate influenced by water. A change in one doesn't automatically validate or disprove a change in the other.
For athletes, pair the scale trend with training performance, recovery and waist or limb measurements. For someone pursuing fat loss, consistent changes in several indicators are more useful than chasing a specific app number. The scale can help you ask better questions, but it shouldn't dictate a response to every fluctuation.
Where a Smart Scale Fits in Your Health Picture
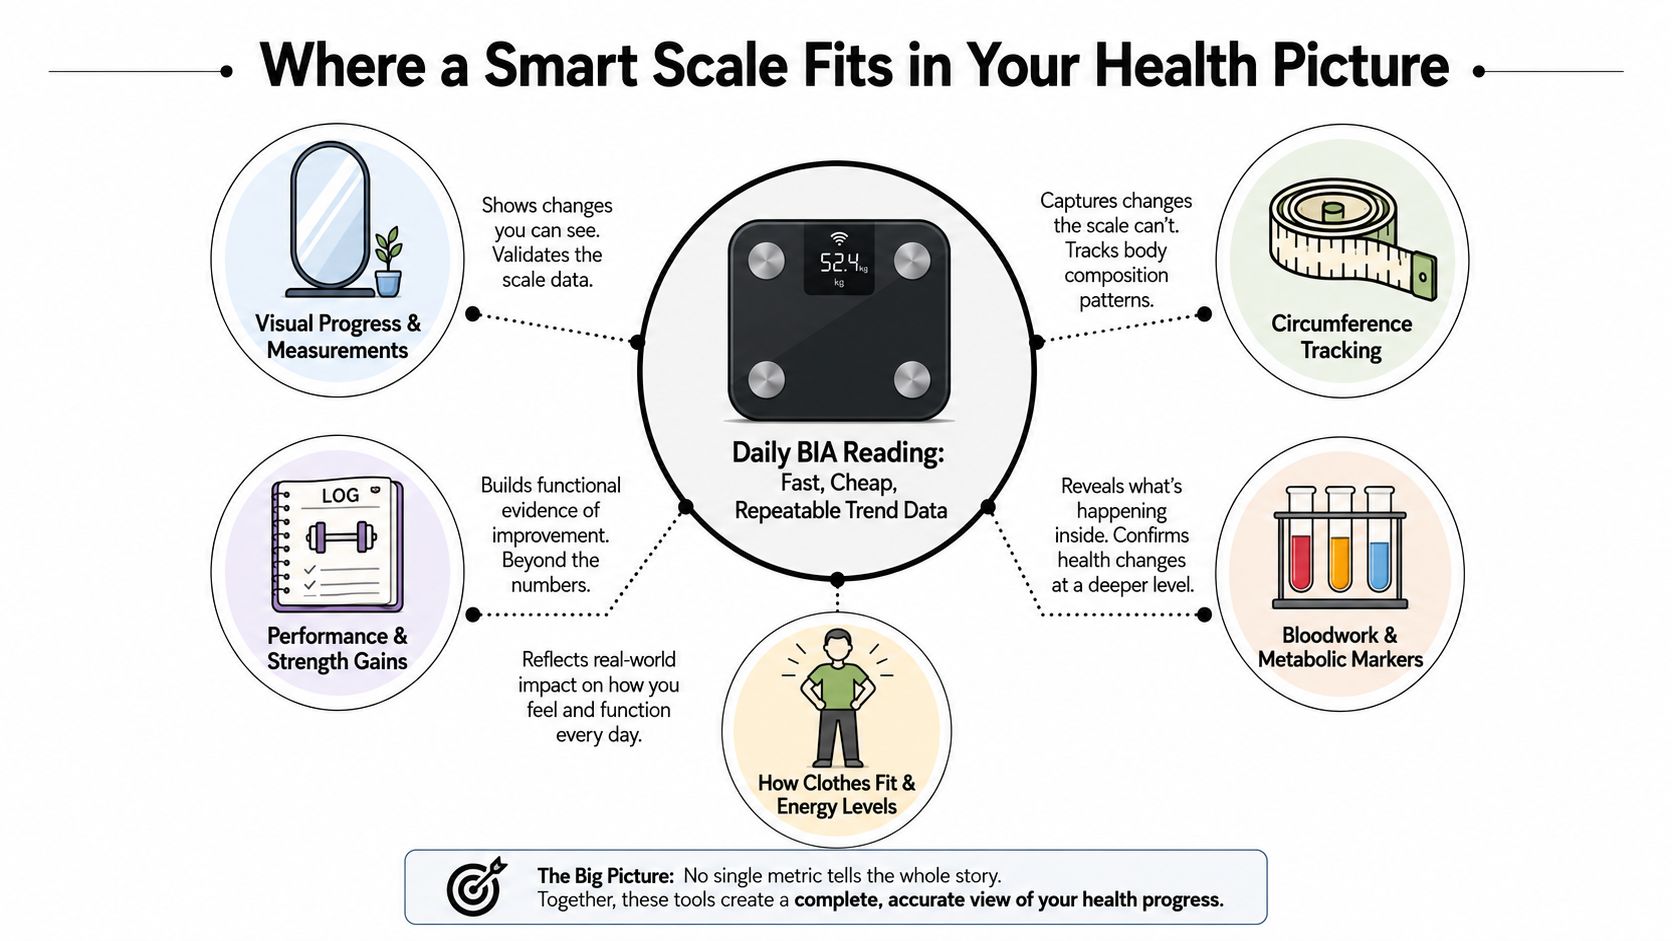
A smart scale works best as one instrument in a wider evidence set. Its main strengths are frequency, convenience and repeatability. You can collect readings at home and watch how the device's estimates behave over time, which may help you notice broad changes in weight and estimated composition.
Its limits are just as important. A standard home BIA reading can't independently confirm visceral fat distribution, lean-tissue quality, bone density, organ-level fat or cardiometabolic risk. An app may display labels for these areas, but the labels remain derived estimates unless a separate validated method measures them.
Match the tool to the question
Use different measures for different decisions:
- Body weight and BIA trend: Useful for frequent home tracking under consistent conditions.
- Waist or other circumference measures: Useful for observing changes in body size when taken consistently.
- Strength and performance logs: Useful for seeing whether training capacity is improving or declining.
- How clothes fit and energy levels: Useful subjective signals that add real-world context.
- Bloodwork and metabolic markers: Appropriate for clinical questions that a scale can't answer.
- DXA, Bod Pod or hydrostatic testing: Useful when you need a more controlled body composition assessment than a bathroom device can provide.
DEXA still belongs in the picture when regional composition, bone mineral information or a more formal baseline matters. It isn't a magic truth machine, but it answers different questions from a foot-to-foot scale. The University of Sydney project's use of a 4-compartment reference model reinforces the central point: device accuracy should be assessed against multi-method standards, not assumed from weight tracking alone.
A smart scale may be enough when your goal is to monitor a broad trend, you can measure under stable conditions and you won't make medical decisions from one percentage. Pair it with a professional assessment when you need an objective baseline, when readings conflict persistently with other evidence or when the result affects a structured sports or health programme.
Speak with a GP or sports scientist if the data causes concern, changes sharply without an understandable context, or conflicts with symptoms, performance or other health measures. An app can organise information, but it can't replace clinical interpretation.
Venus Health Co. offers app-connected home tools including an AI Body Composition Smart Scale with body and trend insights, plus a Bluetooth basal body thermometer and fertility tracking products. Visit Venus Health Co. to explore how those separate signals can be organised in one home health ecosystem, then use your scale as a measured source of trend information rather than a laboratory verdict.