

Basal Body Temperature Ovulation: A Complete Guide
Dr. Adeyinka AdegbosinBasal body temperature ovulation tracking works by catching a small post-ovulation rise of about 0.2 to 0.5°C, and it confirms ovulation only after it's happened, not before. That means BBT is a retrospective confirmation tool, not a way to predict the exact day in advance.
You've probably had one of those mornings where you wake before your alarm, reach for the thermometer on the bedside table, and stare at a number that feels meaningless by itself. One reading rarely tells you much. The pattern across days does. That's why BBT can feel confusing at first, especially if your sleep is messy, your cycle isn't textbook, or you're trying to fit fertility tracking into a real life that includes work, kids, travel, training, or all of the above.
The good news is that BBT gets easier once you stop expecting it to do a job it can't do. It won't tell you when ovulation is about to happen, but it can show you when your body has already moved into the post-ovulation phase. Used well, it becomes a steady, low-cost signal you can combine with LH testing and cervical mucus so you're not relying on temperature alone.
The Morning Moment That Reveals Your Fertile Window
She wakes before the alarm, reaches for the thermometer, and sees a reading that looks ordinary. The number rarely means much on its own. The chart does.
That is the quiet strength of basal body temperature ovulation tracking. It records what your body has already done, not what it might do next. BBT is the lowest temperature taken on morning waking, before movement, food, or stress can shift it.
After ovulation, progesterone rises and acts like an internal thermostat, nudging temperature upward. Australian fertility-awareness guidance describes the charting rule this way, the fertile time ends only after three consecutive days of temperatures higher than the preceding six days, the thermal shift rule used in charting (Huggies Australia). That makes BBT useful, but only as a record of a change that has already happened.
A single reading can mislead. A pattern across days is what matters.
Australian clinical guidance also places the temperature method inside sympto-thermal fertility awareness, where daily temperature tracking is paired with other cycle signs for clearer interpretation (Huggies Australia). That approach helps when sleep is broken, work starts early, or cycles do not behave neatly. Temperature can confirm the post-ovulation shift, while LH testing and cervical mucus help narrow the fertile window itself. Used together, the signs make more sense than any one chart line alone.
Understanding Basal Body Temperature and the Ovulation Shift
Basal body temperature is the body's resting temperature, taken right after waking and before movement changes it. For fertility tracking, the key point is hormonal. After ovulation, progesterone rises and raises the baseline temperature, usually by a small amount.
Why the rise happens after ovulation
Progesterone works like an internal thermostat, nudging temperature up after the egg has already been released. The chart does not predict ovulation first and then confirm it later, it shows the shift after ovulation has already happened. That is why BBT is better for confirmation than prediction.
A Sydney public hospital guide notes that this rise is useful as retrospective confirmation, and if clinical confirmation is needed, a serum progesterone test about 7 days after the rise is recommended (PMC). That timing matters because it follows the body's sequence, not a guess based on one temperature reading.
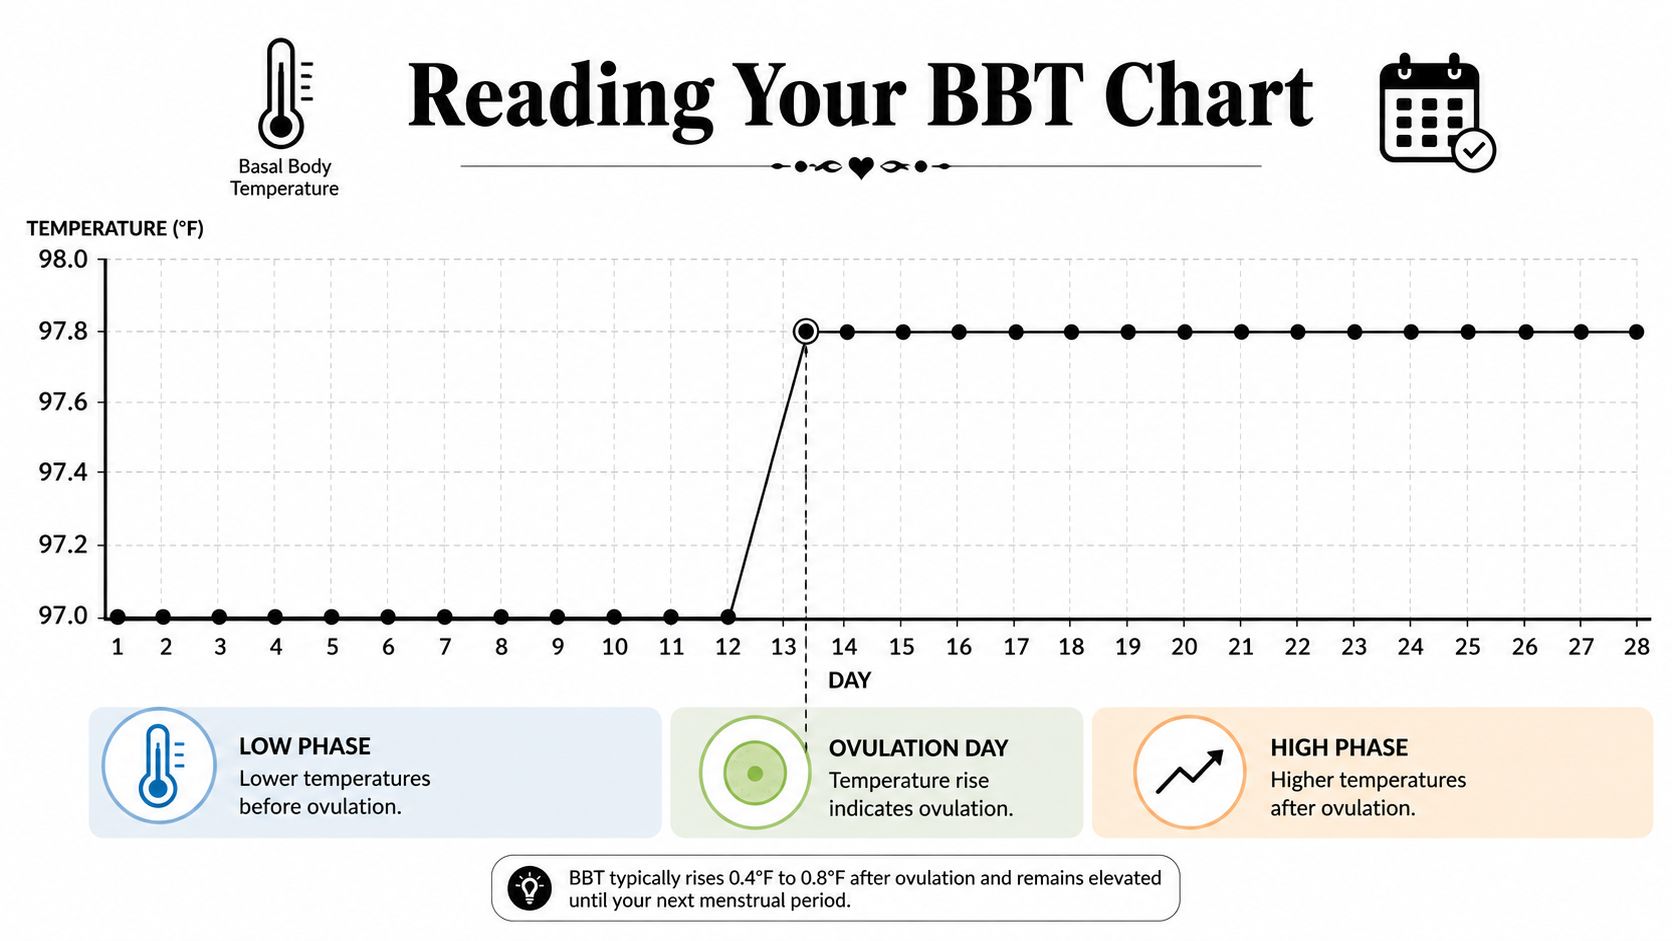
The pattern usually stays high until the next period, so a sustained shift is the part worth watching in daily charting. Australian fertility-awareness guidance describes the post-ovulation thermal shift as a run of higher temperatures rather than a single spike, which is why one unusual morning does not tell the full story (Huggies Australia).
This is also where LH testing and cervical mucus add value. BBT confirms that ovulation likely passed, while the other signs help narrow the fertile window before it closes. If you are also trying to understand whether progesterone support fits your situation, the 200 mg progesterone guide gives useful background to read alongside your cycle notes.
How to Measure and Chart Basal Body Temperature Correctly
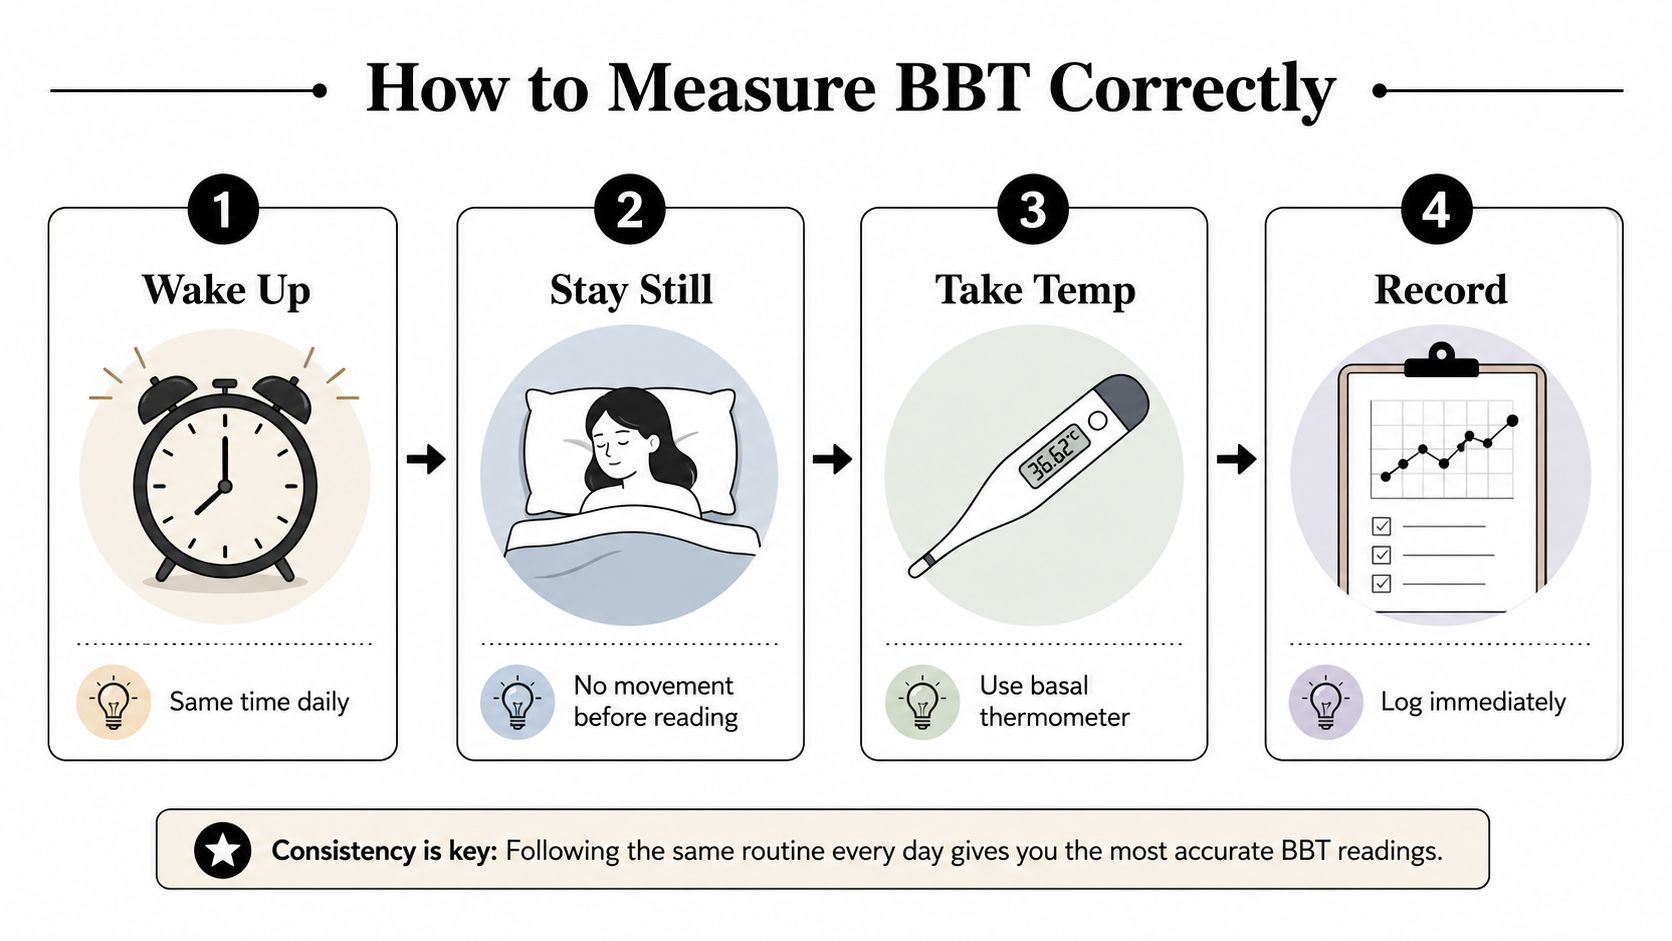
A useful BBT chart starts with a quiet morning. Take your temperature before you get out of bed, before eating, before drinking, and before checking messages. You want the body at rest, because even small movements can blur the reading.
Consistency matters more than perfection. Use the same thermometer, the same measurement site, and roughly the same time each morning, as part of a sympto-thermal routine. A BBT thermometer is better suited to this job than a standard fever thermometer because the changes you are watching are small. A connected device can also reduce transcription errors when you are recording readings over time.
The routine can stay simple:
- Wake and stay still. Keep the thermometer beside the bed so you do not need to walk around first.
- Measure right away. Use one method consistently, oral, vaginal, or rectal, rather than switching back and forth.
- Record it immediately. Paper chart, spreadsheet, or app all work, as long as the value is captured.
- Add context. Note poor sleep, illness, alcohol, travel, or anything else that could affect the reading.
Keep the routine plain and repeatable. That is what makes the chart useful later.
If you want a device that supports automatic syncing, the Venus Smart Basal Thermometer for Ovulation - Bluetooth BBT Tracker with App is built for that kind of tracking, with app-based logging that keeps BBT, LH, symptoms, and cervical mucus in one place.
For a visual refresher on setup, the internal guide at basal body temperature thermometer tips is helpful while you build the habit.
Reading Your BBT Chart to Identify Ovulation Patterns
A chart becomes easier to read when you stop hunting for one dramatic spike and start looking for the pattern across the month. In a typical biphasic chart, the first part of the cycle sits lower, then temperatures rise after ovulation and stay higher until the next bleed. That step up is the signal.
What the chart is actually telling you
The landmark to look for is the thermal shift, followed by three consecutive higher readings than your earlier baseline, the practical confirmation rule used in Australian guidance (Huggies Australia). One high day can happen for many reasons. A cluster of higher days suggests the body has moved into the post-ovulation phase.
That makes BBT useful for timing decisions after the fact. If you see the shift, the fertile window has already passed. If the line stays unclear, that does not automatically mean ovulation did not happen. It may mean ovulation was delayed, the chart has gaps, or sleep changes made the readings harder to interpret.
For readers who want a clearer live signal alongside temperature, the Venus Ovulation Predictor Test Kit provides an at-home LH option. Its listing describes clinical-grade accuracy, results in under 10 minutes, and compatibility with manual tracking or app logging, which makes it practical for pairing prediction with BBT confirmation.
How LH and cervical mucus fill the gap
The combined approach matters because each sign answers a different question. LH testing helps spot the fertile window in real time, since the surge comes before ovulation. Cervical mucus adds another live clue, especially when it turns more fertile in appearance. BBT then closes the loop by showing that ovulation has already happened.
Clinical logic: LH and cervical mucus help you identify the fertile days, BBT helps you confirm that the body completed the ovulatory shift.
That is why temperature alone can feel incomplete for people with irregular cycles or busy routines. A chart can confirm ovulation, but it does so after the body has already made the move. Pairing BBT with LH and cervical mucus gives you a clearer picture of both timing and confirmation without asking one method to do all the work.
Common BBT Chart Mistakes and Why Temperature Alone Falls Short
The most common reason charts look unclear is that BBT was never designed to predict, it confirms after the fact. The rise happens after progesterone has already shifted the body, so a temperature chart is a rearview mirror, not a windshield.
The mistakes that make charts look unclear
A messy chart does not always mean a messy cycle. Broken sleep, illness, alcohol, travel, or inconsistent timing can blur the pattern and make a normal ovulation shift harder to spot. The problem is often the reading, not the cycle itself.
Another common mistake is treating one chart like it should settle everything. BBT is more useful as a pattern over time, because your own cycle tends to be clearer across several months than in one uneven stretch.
What the chart is telling you
A BBT chart is looking for a sustained rise, not a single warm morning. That rise suggests ovulation has already happened. It does not tell you which day is coming next, and that is the point that confuses many readers.
One way to reduce that confusion is to use temperature for confirmation and combine it with live signs that appear earlier. The Venus Ovulation Predictor Test Kit is designed to give an LH signal before ovulation, which makes it easier to pair prediction with later temperature confirmation. Cervical mucus adds another live clue when the fertile pattern becomes more noticeable.
The internal guide to tests for ovulation is a useful companion if you want to compare methods without asking one chart to do all the work.
The evidence also shows why BBT alone can feel limited. In some studies, the temperature shift does not line up neatly with ultrasound-confirmed ovulation, and interpretable patterns are not present in every ovulatory cycle. That does not make the method useless. It means BBT works best as a retrospective check, while LH testing and cervical mucus help you identify the fertile window in real time.
For irregular cycles or busy routines, that combined approach is usually clearer than temperature alone.
Troubleshooting Irregular Charts and Real-Life Disruptors
A messy chart can still be useful. For a shift worker, a parent, or anyone bouncing between time zones, the question is usually not whether every reading is perfect. It is whether the pattern is still readable.
| Chart issue | Likely cause | Practical fix |
|---|---|---|
| Erratic highs and lows | Broken sleep, illness, alcohol, travel | Mark the disruption and keep looking for the next stretch of clean readings |
| Missing days | Overslept, forgot, device left in another room | Resume immediately, and avoid trying to fill in the gap later |
| No clear shift | Delayed ovulation, incomplete data, inconsistent timing | Keep charting and pair the chart with LH and mucus signs |
| Long plateau | Cycle variation, noisy data, or a late ovulation that has not shown a clear rise yet | Check whether mucus and LH suggest ovulation has happened, or whether the chart still looks flat across the full fertile window. If the pattern stays flat after expected ovulation, anovulation is more likely than a simple delay |
If you work nights or sleep badly, the aim is enough consistency to show direction. Even uneven tracking can still reveal a lower phase and a later higher phase over time.
Don't discard a month because two mornings were off. Keep the record, note the disruption, and let the next cycle add context.
When a chart stays unclear, LH tests on expected fertile days can fill in the missing piece. That pairing is especially helpful for irregular cycles, because the temperature rise may come later than expected or look less dramatic than a textbook chart.
Building a Reliable Fertility Awareness Routine
A routine that survives busy mornings is usually the one you can repeat half-awake. Keep one thermometer by the bed, take your reading before getting up, and record it right away. Add LH testing near your usual fertile days, and check cervical mucus so you are not asking temperature to do every job by itself.
If you want one app-connected workflow, Venus Health Co. offers a Bluetooth basal thermometer that syncs readings into its app with LH, symptoms, and cervical mucus. That setup helps people who do not want paper charts or manual spreadsheets first thing in the morning.
Give the pattern time to show itself. With irregular cycles or unpredictable schedules, the value often appears after several cycles of steady tracking, when you can see whether temperature, LH, and mucus point to the same fertile window. Early on, the method can feel slow; later, it starts to make the cycle easier to read.
For a wider look at how the signals fit together, the internal guide at https://www.venushealth.co/blogs/fertility-wellness-journey/fertility-awareness-methods is a useful next read. The basic idea stays the same, temperature confirms, LH points ahead, mucus fills the gaps.
That is where confidence comes from. Calendar guessing loses ground, and daily readings start to show you what your body is doing.